GERS 2021: A DEEP DIVE
06 September 2021
The GERS figures show how pooling and sharing works across the United Kingdom, and also reveal some surprising truths about Holyrood spending decisions. Kevin Hague has crunched the 2021 numbers.
Every year the Scottish Government's Chief Statistician provides an updated analysis of the state of Scotland's public sector finances by publishing the GERS report.
It shouldn't be a very controversial event, but since the independence referendum in 2014 each publication of GERS has been met with a tsunami of media commentary and online argument, with both sides of the constitutional debate seeking to spin the figures in their favour.
In recent years, the GERS figures have shown Scotland's fiscal deficit (as a percentage of GDP or on per person basis) to be much larger than the UK's. Unionists claim this demonstrates the value of fiscal pooling and sharing within the UK, while nationalists suggest it somehow proves that Scotland would be better off as an independent nation or - particularly on social media - they seek to undermine trust in the figures.
GERS Deniers
Those nationalists who promote GERS-denial are indulging in a strategy which is explicitly intended to distract from the simple economic facts.1"The opponents of independence have already shown their hand by focussing on and repeating the GERs figures claiming Scotland is running a 15 billion pound deficit. How can these be discredited, recalculated or reframed?" 11 lessons the Yes campaign must learn to win a second referendum, The National, 6th August 2016 To get dragged into defending the integrity of the GERS figures is to play into the hands of GERS-deniers. They don't need to win the arguments, they just need their supporters to see the figures being argued over and let confirmation bias do the rest: "People are arguing about the figures so they obviously can't be trusted - I'll just go with what my gut tells me."
The inherent advantage GERS-deniers have was neatly summarised by the clergyman George Horne back in 1786:
"Pertness and ignorance may ask a question in three lines, which it will cost learning and ingenuity thirty pages to answer. When this is done, the same question shall be triumphantly asked again the next year, as if nothing had ever been written upon the subject."
Many rebuttals of those trying to undermine the figures have been written (for example here.) But all anybody really needs to know to dimiss the vast majority of GERS-deniers are these three indisputable facts:
-
The decision to publish the GERS report is the Scottish Government's alone [as confirmed by this FOI response]
-
GERS is compiled by the Scottish Government's own team of statisticians and economists (in St Andrew's House, Edinburgh) using methodologies and assumptions they have chosen following years of extensive consultation
-
GERS is an accredited National Statistics publication and carries the quality mark to prove it

Now that's out of the way, let's focus on what the GERS report actually tells us.
The GERS Deficit
In essence the GERS report is a very simple publication which sets out to address just three questions:
-
What revenues were raised by Scotland?
-
How much did the country pay for the public services that were consumed?
-
To what extent did the revenues raised cover the costs of these public services?
Throughout this piece all figures quoted are on the basis that Scotland is allocated a "geographical share" of North Sea revenue. In layman's terms this means Scotland gets to keep the revenues generated by "Scotland's Oil"2In recent years Scotland has actually been apportioned more than 100% of the UK's North Sea Revenues, because Petroleum Revenue Tax rebates are weighted towards fields in English waters. So we need just three numbers to answer those question for 2020-21:
-
£62.8 billion of revenues were raised by Scotland
-
£99.2 billion was the cost of public services consumed by the country
-
£36.3 billion was the difference between revenues raised and the costs of these public services
So the GERS figures show Scotland (as part of the UK) running a deficit3Alternatively: a negative net fiscal balance of £36.3 billion or 22.4% of GDP (compared to the overall UK deficit of 14.2% of GDP).
In the context of the independence debate this 8.2% deficit gap is an important number, because (all else being equal) it shows how much bigger an independent Scotland's deficit would be than that Scots currently share as part of the UK. Of course all things wouldn't be equal, but we'll come to that.
The following point can't be stressed too much: while Scotland is an integral part of the UK, the GERS deficit is merely a paper exercise.
-
Scotland's public spending is not constrained by the GERS deficit, because the capacity for public spending in Scotland is ultimately determined by the UK's overall economic position
-
Scotland is not accruing a debt liability as a result of the notional GERS deficit, because Scotland pools and shares its deficit and debt with the rest of the UK
The Deficit Gap (aka the Fiscal Transfer)
While some fringe nationalists might want to argue that Scotland shouldn't be responsible for any of the UK's debt, the GERS figures expose how morally indefensible that position is. Scots get their fair share of benefit from UK public spending, it would be outrageous to suggest they shouldn't bear any responsibility for the debt used to fund it.
What is widely accepted (and is implied within the GERS calculations) is that Scotland should bear a population share of the UK's shared debt.4This was the starting position assumed in the Independence White Paper and the SNP's more recent Growth Commission report - and the GERS report itself allocates a population share of the shared UK debt interest to Scotland. For detail geeks: public sector pension fund interest receipts and expenditure are known for Scotland and - because Scotland's public sector employment is larger - the share of both is larger than Scotland's population share (which excites some people when they see the allocation on the cost side, but per GERS p.7 Q2, the receipts and expenditure largely cancel each other out anyway).
Those Nationalists who try to dismiss any talk of a Fiscal Transfer "because it's borrowing on our behalf" are simply misunderstanding what the Fiscal Transfer is: it's the difference between Scotland's population share of the UK's deficit (i.e. Scotland's share of the increase in the UK's debt) and the GERS deficit (i.e. Scotland's actual contribution to that increase in the UK's debt).
To illustrate for 2020-21 when the UK's deficit was £297.7bn:
-
Scotland's 8.1% population share of the UK's deficit was £24.3 billion - this is the implied increase in Scotland's share of the UK's debt liability
-
Scotland's actual contribution to the UK's deficit (i.e. the GERS deficit) was £36.3 billion - this is the implied contribution Scotland's economy actually made to that debt liability
-
The difference - the benefit to Scotland of only having to assume a population share of the UK's deficit (in the form of a population share of the UK's debt) was £12.1 billion5There's a rounding effect in the number presentation - with one more decimal place we can see £24.26 billion minus £36.34 billion = £12.08 billion
So in 2020-21 GERS shows an implied fiscal transfer between the rest of the UK and Scotland of £12.1 billion - that's £2,210 for every man, woman and child in Scotland.
To reiterate (because it comes up time and time again): this is absolutely not funded by debt which Scotland is expected to assume a liability for, it is the difference between Scotland's population share of the UK's debt and Scotland's contribution to that debt.
In a final attempt to hammer this point home: anybody arguing that the fiscal transfer doesn't exist would have to argue that Scotland's share of the UK's debt went up by £36.3 billion last year (i.e. that Scotland would be responsible for 12.2% of the increase in the UK's debt, because Scotland was responsible for 12.2% of the UK's deficit6Richard Murphy has stated in previous years "I have been continually bemused by the fact that GERS [...] says that Scotland runs a deficit so much larger in proportionate terms than that for the UK as a whole [...] Proportionately the Scottish deficit is suggested to be, after North Sea revenue is taken into account, 3.45 times that of the UK as a whole." Presumably he will be even more bemused now that the deficit has grown and Scotland's deficit is proportionately only 1.6 times larger than the UK's as a whole. Iain McWhirter said in the Herald last year: "But even then, as the tax expert Professor Richard Murphy has pointed out, it is absurd to claim, as GERS has in recent years, that Scotland with 8% of the UK population accounts for nearly 60% of the entire UK deficit. This just doesn't make sense." It was never absurd, as explained here and here). Now the absolute deficit has grown, Scotland is only responsible for 12% of the UK's deficit.). I don't think any of them are arguing for that.
Isn't this just a snap-shot?
GERS actually provides data going back 23 years. While most commentary focuses on the absolute size of Scotland's deficit, it is also helpful to understanding how the Fiscal Transfer (aka Deficit Gap) has changed over that period:
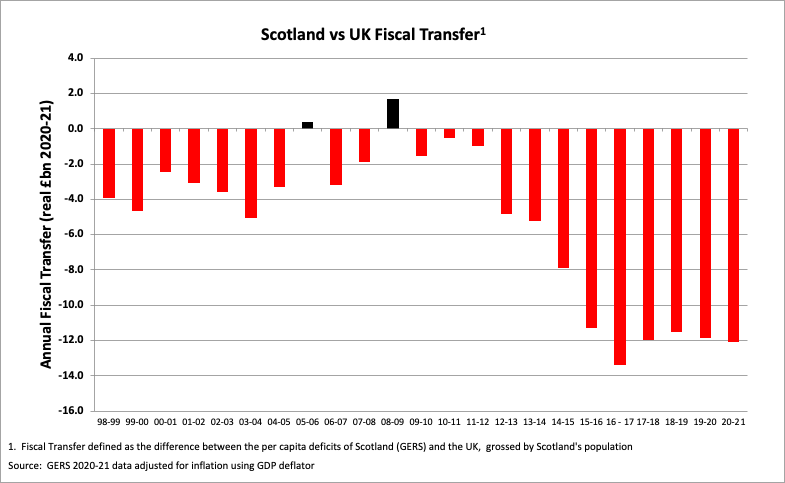
As the graph above clearly shows, the Fiscal Transfer in Scotland's favour has been well over £10 billion a year for each of the last six years. In fact, the data shows that Scotland has only been a net fiscal contributor to the UK in two of the last 23 years.7The figures being used in 2014 showed a slightly more favourable position for Scotland, but the GERS figures have since been revised, most notably by amending with more accurate (lower) North Sea revenue figures.
We will come on to show that the historical fluctuations in the fiscal transfer are almost entirely explained by movements in North Sea revenues.
While the GERS data only goes back to 98-99, the Scottish Government's Scottish National Accounts Project (SNAP) previously attempted to take the analysis back to 1980. These older figures need to be treated with some caution (they appear generous to Scotland8Whereas historical GERS figures are continually restated to reflect changes in accounting policies and more up-to-date understanding of the data, the SNAP figures were last updated in 2012-13 and so will not be strictly comparable. In the years where SNAP and GERS overlap, the SNAP deficit is on average £1.5bn lower than the GERS deficit (i.e. the SNAP data is favourable to Scotland compared to our more recent understanding). By inspection, the net difference is mainly explained by higher spending allocations in GERS compared with historical SNAP data.), but they do illustrate that in the years when North Sea oil was booming, Scotland could be considered a very significant net fiscal contributor to the UK.
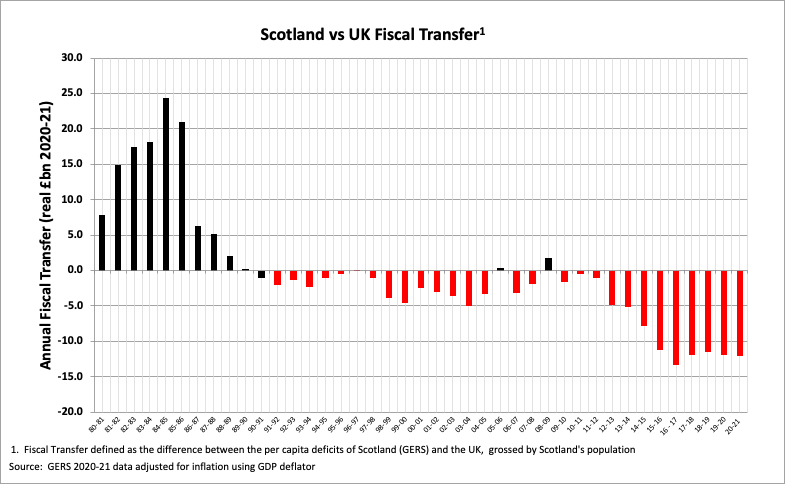
This graph is evidence of pooling and sharing within the UK working over time. When North Sea oil was booming, Scotland was a major contributor to the UK; now North Sea oil revenues are a mere trickle, Scotland is a major beneficiary.
The direction of the fiscal transfer doesn't seem to faze Scottish nationalists - in whatever direction the transfer flows, it will be argued as a reason to break up the UK.9Fiscal Transfers and Shifting Narratives, These Islands, 17th July 2020
That said, the longer the current economic situation persists, the harder it becomes for nationalists to sustain the "Westminster stole our oil" grievance. Over this 41-year period - the longest period for which we have the data and a period which assumes a starting point highly favourable to the nationalists' argument - Scotland is in fact a net beneficiary of fiscal pooling and sharing within the UK (the red bars outweigh the black).
This is neatly illustrated by the cumulative picture:
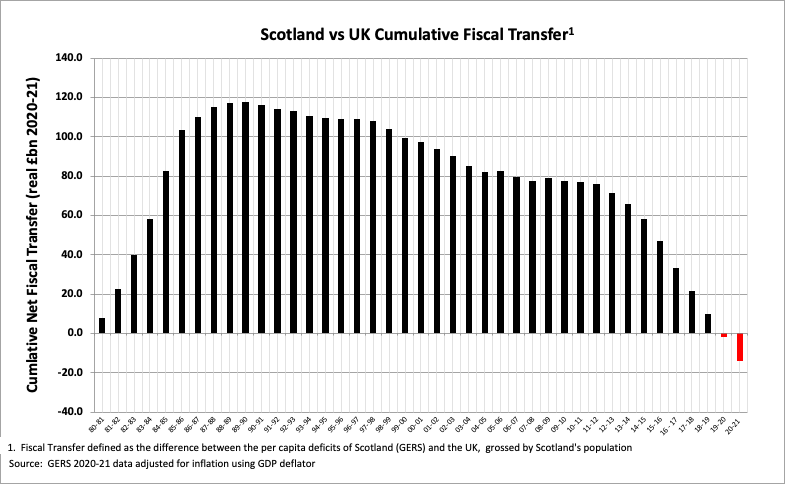
This shows that, as of now, Scotland has "got back" from the UK (largely in the form of higher public spending) more than it "put in" during the 1980's as a result of the oil boom years.
If Scotland's Deficit is so large, doesn't that prove being in the UK is bad for Scotland?
The simple answer to this question is: No.
To explain why, we need to understand the extent to which that larger deficit is a function of lower revenue generation (relatively poor economic performance) and to what extent it is due to higher public spending (doing relatively well out of pooling and sharing).
The GERS report puts Scotland's revenue and spending numbers in context by comparing them to figures for the whole of the UK (including Scotland) on a per person basis. This shows us that in 2020-21:
-
Scotland generated £382 less revenue per person than the UK average [Table S.4]
-
Scotland's spending was £1,828 more per person than the UK average [Table S.6]
Although the report doesn't put this figure in a summary table, the inevitable result of the figures above is that Scotland's deficit per person is £2,210 greater than the UK average. Multiply that £2,210 per head by Scotland's population of 5.47m and we've found another way to get the implied Net Fiscal Transfer of £12.1 billion.
This tells us that more than 80% of the Fiscal Transfer is explained by the fact the UK's system of pooling and sharing leads to higher spending per person in Scotland. It's hard to see how even the most committed separatist could argue that this is a bad thing.
Once we appreciate that the Deficit Gap (aka Net Fiscal Transfer) is the summation of differences in revenue generation and spending per person, we can squeeze some more insight from the historical GERS figures.
In the graph below:
-
The red line shows how much higher Scotland's spending per person has been than the UK average over time
-
The black line shows how much higher/lower Scotland's revenue per person has been
-
The green line shows how much lower Scotland's onshore revenue (i.e. excluding North Sea revenues) has been
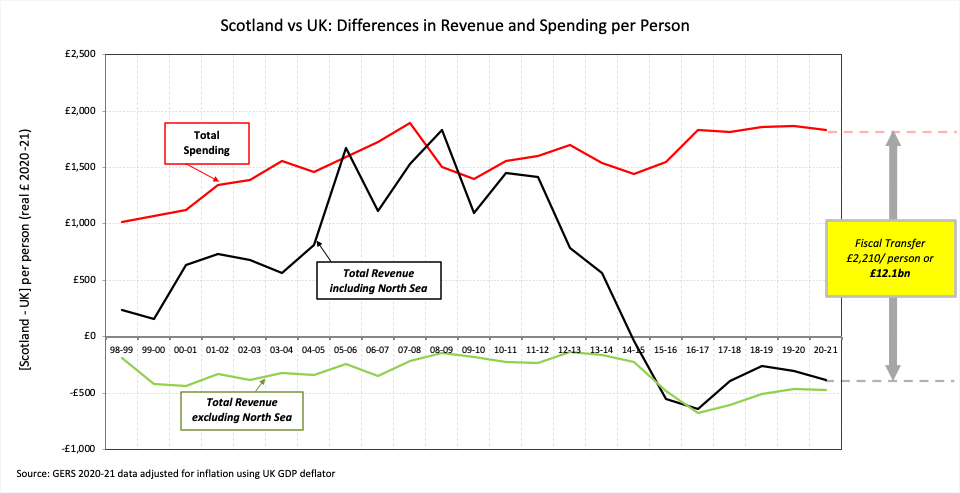
The gap between the red and black lines is the Fiscal Transfer; the gap between the red and green lines is the Onshore Deficit Gap (i.e. the size of Fiscal Transfer that would exist if there were no North Sea revenues).
There's a lot to digest in this graph:
-
The red line shows that the gap between spending for Scotland and the UK average has actually grown over this period10Some people assume the "Barnett Squeeze" should inevitably lead to convergence in spending - this isn't the case because of differential rates of population growth between Scotland and the rest of the UK. If you think about it: if spending didn't change at all but Scotland's population grows more slowly than the rest of the UK's, Scotland's spend per head will be less diluted by population growth than that of the rest of the UK. For more on this topic, see What is the Barnet Squeeze.
-
The green line shows that Scotland's Onshore Revenue generation only slightly lags the UK average, although that gap grew materially between 2014 and 201711Possible explanations for this incude: (1.) The decline in the North Sea industry will have had knock-on effects on the onshore economy. (2.) Increases in personal tax rates in recent years have either led to a change in, or a better understanding of, the actual number of higher rate tax payers in Scotland. (3.) The ongoing constitutional uncertainty, which can surely not have helped business confidence.
-
Throughout this period there has been a large Onshore Deficit Gap (the gap between red and green lines) which is revealed when North Sea revenues decline
-
The scale of the Onshore Deficit Gap is consistently explained largely by relatively higher Scottish public spending
-
Fluctuations in the Fiscal Transfer are dominated by fluctuations in North Sea revenues (the gap between the black and green lines) - when oil revenues decline, the Onshore Deficit Gap is revealed. This was clear in 2014 and illustrates why the economic case for independence was always a reckless gamble on future oil revenues
Isn't this because GERS unfairly allocates UK-Wide spending to Scotland?
In a word: No.
In GERS, UK-wide costs considered to benefit the whole of the UK (e.g. Defence, Overseas Development Aid, UK Debt Interest, Whitehall Departmental Costs, DWP and HMRC overheads etc.) are allocated to Scotland on a per person basis (i.e. Scotland is allocated an 8.1% population share of these costs). This means that by definition there is no difference between the cost per person allocated to Scotland and to the rest of the UK in these categories.
How much an independent Scotland might spend to replicated the services delivered by these currently shared UK costs is a not a question the GERS report is designed to answer. It is highly unlikely that an independent Scotland could replicate HMRC, DWP, Treasury, FCO, DFID, Cabinet Office, BEIS etc. functions for less than the 8.1% of these UK departments' costs which are allocated to Scotland in GERS.12Richard Murphy on GERS: The Perpetually Baffled Man, chokka blog, 25th August 2021
So why is Scotland's spend per person so much higher?
The table below shows where the £1,828 per person higher expenditure comes from in 2020-21.
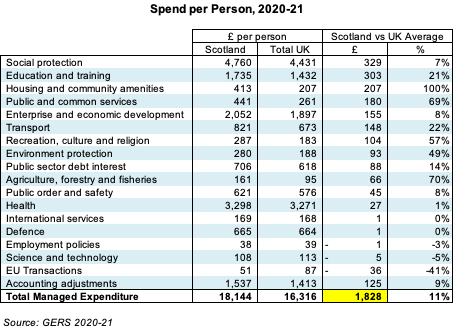
Note that there is no difference in spend per person on Defence and International Services because, as explained above, these are allocated in GERS on a per person basis.
Scotland has a lower population density than the UK average, extensive remote and island communities and particular demographic challenges which makes it inevitable that it will cost more per person to deliver equivalent services in some categories. Whether the actual level of higher spend the GERS figures reveal can be entirely justified on a like-for-like cost-to-serve basis is an unanswered question.
Some particularly notable points:
-
The biggest absolute difference in spend per person is on Social Protection (i.e. pensions and benefits), an area which is almost entirely reserved to Westminster13See Box 3.2 and Table 4.4 in the GERS report. This demonstrates a fundamental but too often over-looked point: under current constitutional arrangements, Scotland is guaranteed to get its needs-based share of reserved social protection spend. The amount spent in scotland is determined directly by how many people in Scotland qualify for the relevant pensions and benefits, no Barnett Formula calculations or inter-governmental negotiation are required. Scotland gets a significantly higher share of Social Protection spending than the UK average as a result and - assuming one believes in the principle of UK-wide social solidarity - that is demonstrably fair (and an advert for the merits of reservation).
-
Those seeking to undermine the GERS methodology often make an uninformed fuss [discussed at length here] about the Transport spending allocation, mainly because it used to include an allocation for HS2 costs which were not incurred in Scotland. This was never a material issue, but in a welcome move the Scottish Government's statisticians have chosen to now completely exclude any HS2 allocations from the GERS figures. This means that there are literally no infrastructure costs which take place outside Scotland (transport or otherwise) allocated to Scotland in GERS.14You can check this by surfing the "supplementary-expenditure-database" which accompanies the GERS report - the biggest source of confusion is the allocation of UK Government Network Rail costs (the organisation responsible for Scotland’s rail infrastructure) which is quite reasonably allocated based on actual Train Operating Company usage in Scotland.
-
The fact that Public and Common Services is relatively so much higher than the UK is another trigger for those who like to look at a number they think doesn't feel right and cry "foul!". Scotland has a large public sector and these numbers are entirely reasonable and fully explained within GERS, as detailed here.
-
The figure which may surprise some is that Health spending is only 1% higher per person in Scotland than the UK average. We will discuss this further in the next section.
What does this tell us about the Scottish Government's priorities?
Perhaps the most interesting way to look at the realtive spend per person data is to consider how it has changed over time. The graph below shows the differences between Scotland and the average of rest of the UK spend per person over time, by category (the health spending line has been highlighted):
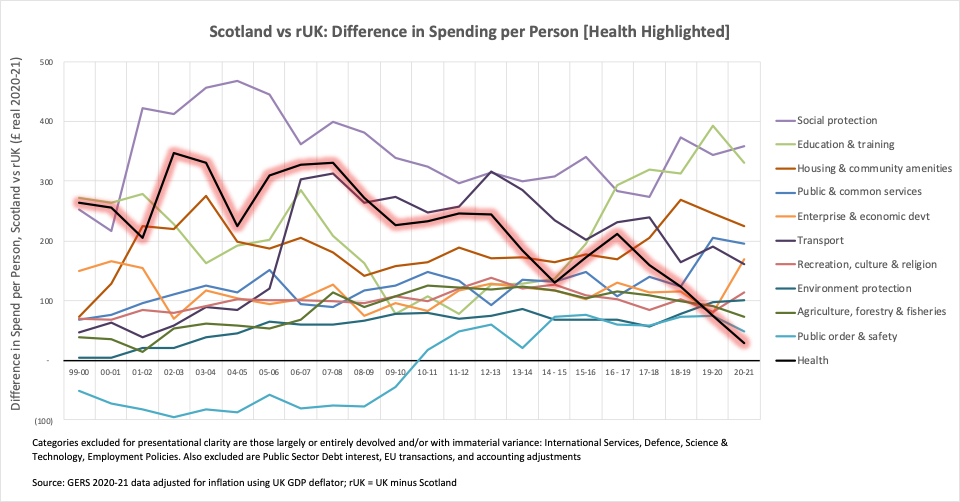
The relative decline in health spending over recent years is particularly marked. It is of course the case that funding increases in the health service in the rest of the UK are automatically passed on to Scotland via the Barnett Formula, so the decision to deprioritise spending on health has been the Scottish Government's alone. This shouldn't come as a surprise given that in April 2021 (i.e. using 2019-20 figures) the IFS observed: "Official estimates suggest Scottish health spending per person now 3% higher than in England, compared with 22% at the start of devolution".
It's worth drawing attention to three items:
-
The relative increase in education spending
-
The relative increase in Public Order & Safety (i.e. Police) spending - presumably largely due to the centralisation of Police Scotland
-
The recent relative up-tick in enterprise and economic development spending
Whether these relative spending increases have delivered improvements in service delivery is, at best, a moot point.
There is one other piece of information buried in the GERS tables which seems worth highlighting. Table 3.2 shows that in the last year Scottish Local Government spending declined by 0.9% whereas in the UK overall it increased by 16.5%. It is hard to see how one could interpret this as anything other than the SNP Government centralising and taking power away from local government.
Aren't these figures meaningless when it comes to the case for Independence?
The GERS figures are historical actual figures, so they can only reflect the performance of the Scottish economy under current constitutional arrangements. That is: sharing the UK's machinery of state, operating within a borderless UK single market, sharing a central bank and currency, pooling and sharing resources and accepting that some tax and spend decisions are reserved to Westminster.
Those caveats matter, but they certainly don't make the figures meaningless: they still tell us what revenue the Scottish economy currently generates and how much it costs to deliver the public services that Scots are used to receiving. They provide a base-line against which those wishing to make an economic case for separation can argue what would change.
None of that prevents us being able to draw some simple conclusions from the figures as they stand, as the SNP proved in 2014 when their chosen line on the GERS figures was:
"Scotland accounted for 9.3% of UK public spending between 2008-09 and 2012-13, while generating 9.5% of tax receipts - it put in more than it got out. It suggests that tax receipts are currently 14% higher in Scotland than the rest of the UK"
The latest GERS figures allow us to update this statement for the most recent five year period:
"Scotland accounted for 9.2% of UK public spending between 2016-17 and 2020-21, while generating just 7.9% of tax receipts - it put in less than it got out. It suggests that tax receipts are currently 3.5% lower in Scotland than the rest of the UK"
So back when the SNP could lay claim to significant North Sea revenues, the GERS figures were used to argue that Scotland "put in more than it got out" because Scotland had higher per person tax receipts which more than offset Scotland's higher per person spending.15Since those figures were quoted, the GERS figures have been revised down (mainly by correcting down the oil revenues attributed to Scotland) - so using the updated figures for the same time period we would actually say: "Scotland accounted for 9.3% of UK public spending between 2008-09 and 2012-13, while generating 9.3% of tax receipts". So in fact even during those relative boom years for North Sea revenue, Scotland merely paid its way on the SNP's own terms.
Since then North Sea revenues have declined (to the surprise of nobody who was paying attention in 2014) and so the same analysis now shows that despite generating slightly [3.5%] lower tax receipts than the the UK average, Scotland continues to benefit from significantly [11.2%] higher public spending.
Is this fair?
Whether all of this is fair or not depends on your perspective. It can certainly be argued that this is merely pooling and sharing of resources across the UK working effectively over time. When oil boomed in the 1980's, Scotland "put in more than it got out"; now oil revenues have declined to a trickle, Scotland "gets out more than it puts in".
From a less transactional and more philosophical perspective: if you believe that pooling and sharing is weakness - that a tighter line should be drawn around those that should have to "stand on their own two feet" - then you might see the fiscal transfer revealed by the GERS figures as a reason to break up the UK.
Alternatively, if you believe that fellow citizens of this union should not have the quality of their healthcare, education or social welfare constrained by the revenue generating performance of their constituent nation (or region), the GERS figures merely offer a quantification of what it means when we say “it’s good to share”.
Please log in to create your comment