WHY NOT SCOTLAND?
14 July 2022
The Scottish Government plans to publish a series of papers outlining a refreshed case for independence. The first of those papers - a “scene-setter" - was published on 14th June 2022. It compares the UK to a hand-picked selection of European comparator countries. Unfortunately it doesn't include any data for Scotland and skirts around the question of how different countries approach the trade-off between tax and spend.
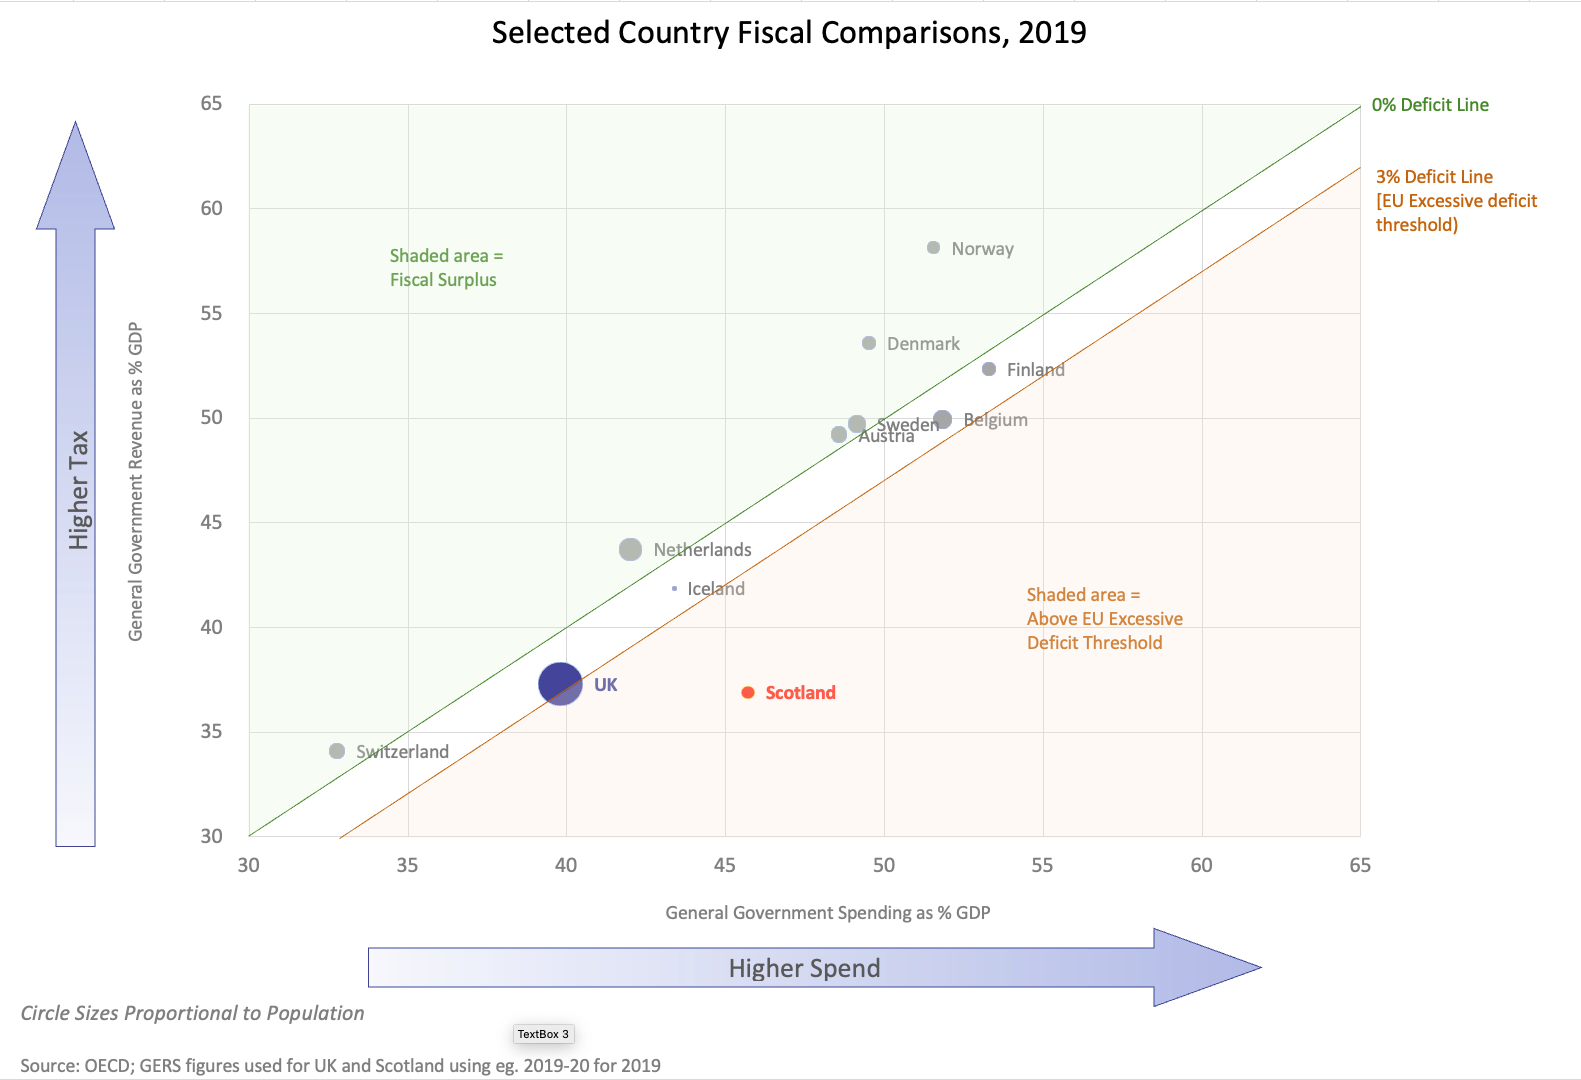
An appendix to this piece walks through the journey from the bar charts presented by the Scottish Government to a more complete and informative presentation of comparative country data. But you don't need to travel that full journey to appreciate the view we reach at the destination: the chart above compares the fiscal position of Scotland (in the UK) with all European OECD countries.
It clearly shows what the Scottish Government's paper failed to address: some combination of higher taxes and/or lower spending would be required for an independent Scotland to achieve fiscal sustainability (ie. to move up and/or to the left on the graph and get within the EU's 3% excessive deficit threshold).
In fact these international comparisons neatly illustrate that the UK's pooling and sharing of tax revenues allows Scotland (in the UK) to benefit from levels of government spending that would otherwise be unsustainable without significantly higher taxes in Scotland.
Those who attempt to obfuscate this debate by questioning the validity of the data for Scotland are arguing with National Statistics published by the Scottish Government and don't deserve to be taken seriously.
Those supporters of Scottish independence who do wish to be taken seriously need to explain how the revenues raised by the government of an independent Scotland could increase and/or how the cost of public services consumed could decrease relative to these "in the UK" figures.
We can immediately see from this chart that tax revenues would need to increase and/or public spending decrease by c.6% of GDP just to get within the EU's 3% excessive deficit threshold and achieve the SNP's stated aim of being, in fiscal terms, "just like a normal independent country" (of whatever size).
All the countries on that chart have established currencies (or did so as pre-conditions of joining the EU and/or the Eurozone). An independent Scotland would no longer be in a formal Sterling currency union and we are told a new Scottish currency would be created as soon as practicable. That realistically means some combination of fiscal and/or current account surplus would be required.
Even if we just look at the countries the Scottish Government hand-picked as comparators, plenty of them run a fiscal surplus in normal times so, to coin a phrase, why not Scotland?
To run a fiscal surplus would (on these pre-pandemic figures) require tax rises or costs savings of 9% of GDP. That is the equivalent of a 20% decrease in total government spending or a 24% increase in total government revenue.
To help those trying to make these numbers stack up, let's put 6 - 9% of GDP in the context of some existing Scottish revenue figures as % of GDP...
-
Income tax: 7.3%
-
National Insurance: 6.4%
-
VAT: 6.1%
-
Onshore Corporation Tax: 1.7%
-
Tobacco & Alcohol Duties: 1.3%
... or specific Scottish spending figures:
-
Social Protection (inc Pensions): 13.5%
-
Health: 7.7%
-
Education and Training: 5.2%
-
Public Sector Debt interest: 2.9%
-
Defence: 1.9%
So the exam question for the SNP is a simple one: with reference to these current tax and spend figures, how would you achieve fiscal sustainability let alone the surplus position most of your chosen comparator countries achieve?
***
None of this is to deny the fact that historical actual figures can only represent Scotland as an integral part of the UK - the question is what would those reserved policy decisions and reserved spending allocations be replaced by?
The SNP's Sustainable Growth Commission suggested addressing the fiscal conundrum by simply reducing government spending as % of GDP (a policy more commonly referred to as "austerity") - but in doing so they failed to address any of the following rather important questions:
-
Many significant tax and spend decisions are currently considered to be best made on a UK-wide basis and are therefore reserved to Westminster; what different decisions might an independent Scotland make in areas such as income tax, VAT, corporation tax, social welfare spending etc. and what would the realistic net fiscal result be?
-
In answering the above, what consideration has been given to the likelihood of capital and talent flight associated with higher tax-rates and currency uncertainty?
-
Some reserved UK spending is considered to be of equal value to all parts of the UK and so is allocated on a population basis. Compared to these allocated figures, what levels of expenditure would an independent Scotland commit to in areas such as defence and international development aid and what would it cost an independent Scotland to replicate and run what is currently the UK's shared machinery of state (e.g. HMRC, DWP, Home Office, Border Force, Treasury, etc.)
-
In answering the above, what consideration has been given to the defence spending requirements of NATO membership and the practical economies of scale when it comes to institution building (i.e. would stand-alone Scottish HMRC, DWP, Home Office, Border Force, Treasury etc. functions cost more or less than the 8.2% of the total UK cost of these institutions which is allocated to Scotland today?)
-
Scotland has 8.2% of the UK's population but 10.0% of the UK's civil service jobs are based in Scotland. Given that in reserved functions such as DWP, HMRC, MoD, DfID and OFGEM (costs of which are allocated on a population share basis) significantly more than Scotland's population share of staff are located in Scotland, what assumption is made about the future of those jobs and any related fiscal multiplier effects?1
-
There are other costs incurred in Scotland which are not charged to Scotland in these spending figures - for example 29% of Scottish Government ferries costs are allocated to the rest of the UK and nuclear decommissioning costs in Scotland are shared with the rest of the UK on a population share basis - what assumption is made about who bears those costs in the future?
-
The Growth Commission and the Scottish Government both cite and therefore presumably accept analysis which suggests Brexit-related trade friction will harm UK GDP growth. Given that 60% of Scotland's exports go to the rest of the UK, what assumptions are being made about the impact on Scottish GDP of trade friction resulting from the creation of a Scotland/rUK border?
-
Having answered all of the above, what is the realistic outlook for an independent Scotland's fiscal deficit over time - and with what implications for Scotland's cost of debt and ability to build currency reserves?
Where the Sustainable Growth Commission suggested reducing spending as a % of GDP, this latest Scottish Government paper hints at increasing taxes.2 Whichever approach would be taken - and the scale of the challenge points towards both spending reductions and tax increases being required - it is hard to avoid the conclusion that the real-world implications for the people of Scotland would be eye-wateringly painful.
The fiscal challenge an independent Scotland would face is the elephant in the room - if the SNP are serious about a referendum in 2023, they must address it.
***
NOTES
1. See Civil Service Statistics, all in the context of Scotland's 8.2% share of the UK population:
45,650 or 10.0% of the UK's 456,420 civil servants are based in Scotland, including in reserved functions:
-
8,260 DWP employees, 10.5% of the UK total
-
7,800 HMRC employees, 12.2% of the UK total
-
3,600 MoD employees, 9.7% of the UK total
-
950 DfID employees, 36.0% of the UK total
-
370 OFGEM employees, 37.8% of the UK total
2. See Independence in the modern world. Wealthier, happier, fairer: why not Scotland? Page 50:
"Why are most of the comparator countries able to sustain relatively high spending over the long-term? Evidence suggests that higher confidence in government is correlated with higher levels of willingness to comply with taxes [...] relatively high government revenues are not – as is often claimed – a barrier to growth and economic dynamism [...] “Far from impeding prosperity, it is high-growth countries that tend to have a larger share of tax revenues in GDP."
***
Appendix: The Journey
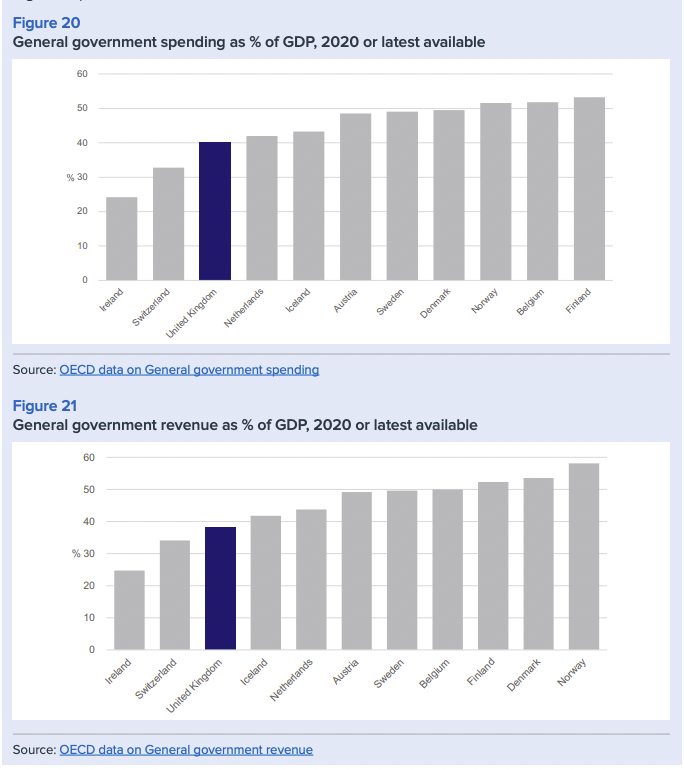
What the Scottish Government Paper Included
The Scottish Government's paper included two mislabelled (the data is for 2019) bar charts of government spending and revenue as a % of GDP for the UK and their chosen comparator countries:
Data exists to be able to include Scotland (as part of the UK) as well. So I recreated the charts with Scotland (as part of the UK) added:
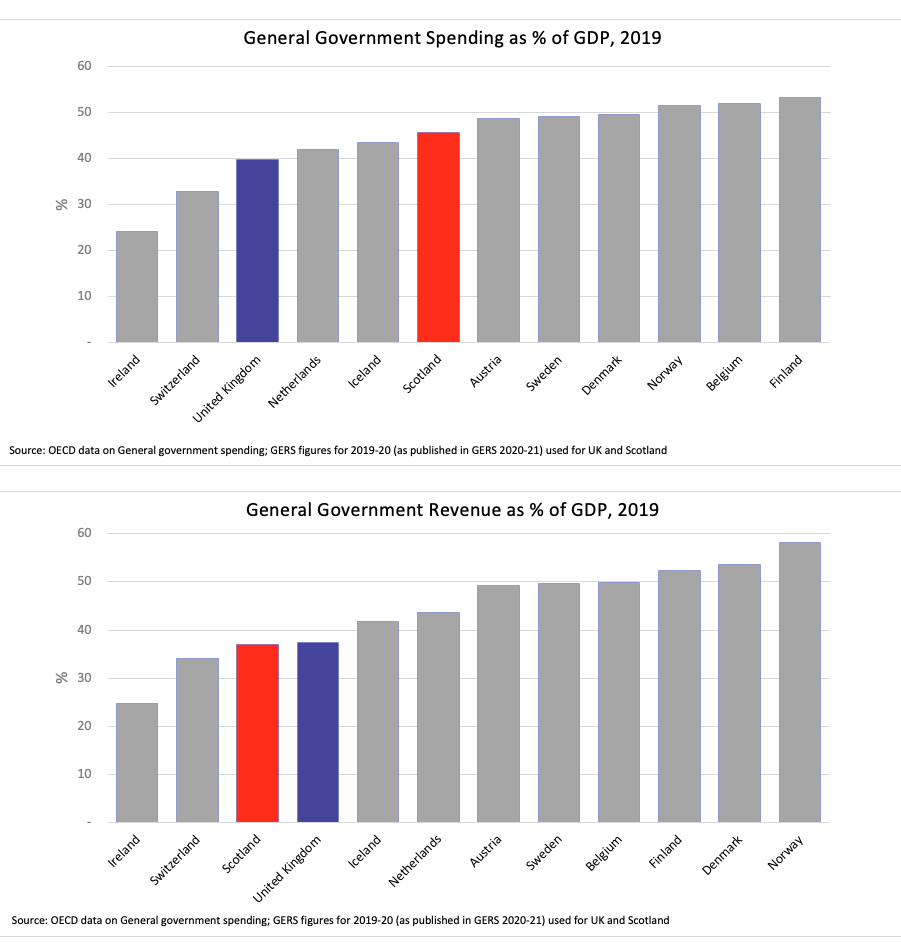
It's immediately obvious that Scotland (as part of the UK) benefits from higher spending than the UK average despite bearing basically the same tax burden. We can also observe that countries with similar or higher levels of spending than Scotland (as part of the UK) all have far higher revenue (aka taxes) - although that's quite hard to read across these charts.
Improving the Data presentation
The difference between a country's government revenue and government expenditure is of course its fiscal balance. So why not present the data on a single chart in a such a way as to show that relationship, use circle-sizes to indicate relative population sizes and indicate where the EU's Excessive Deficit Threshold sits?
Taking a wider view
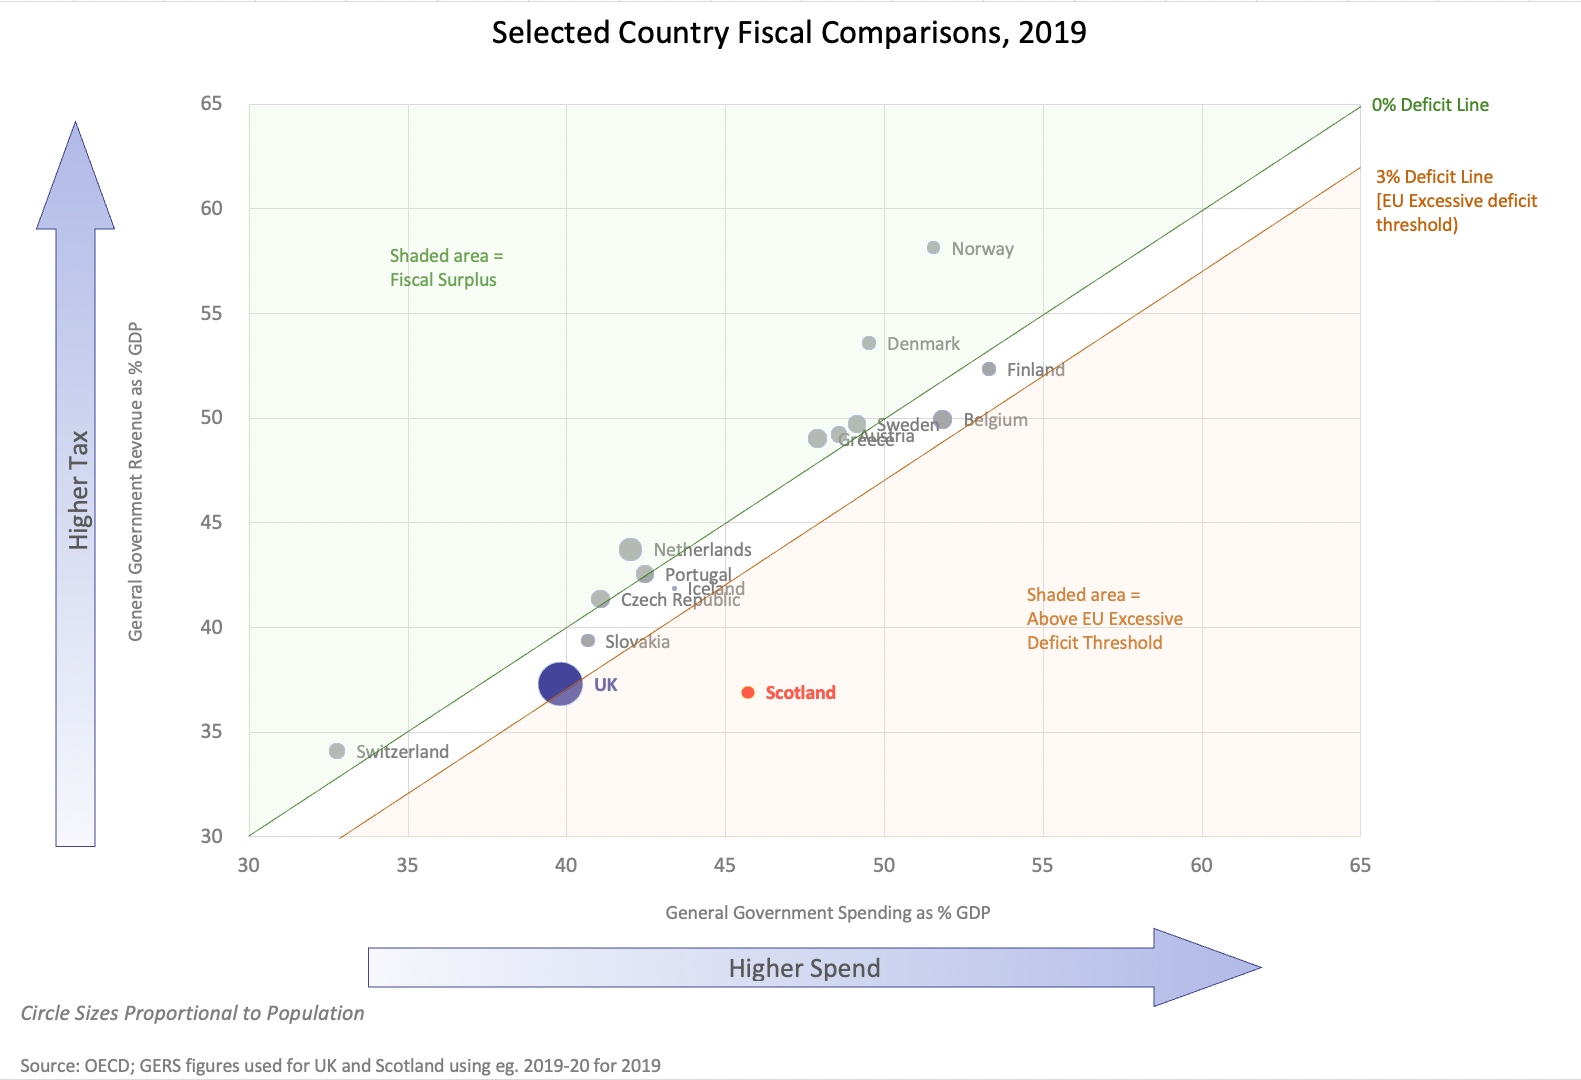
Having pulled together the data in this format we can also add Greece, Portugal, Slovakia and the Czech Republic (the European small advanced economies the report chose to exclude) ...
... and there's no reason not to include the other European countries as well to give us a more complete picture and, while we're here, go back to 2017 and show how the picture has evolved up to and including the first pandemic-affected year of 2020.
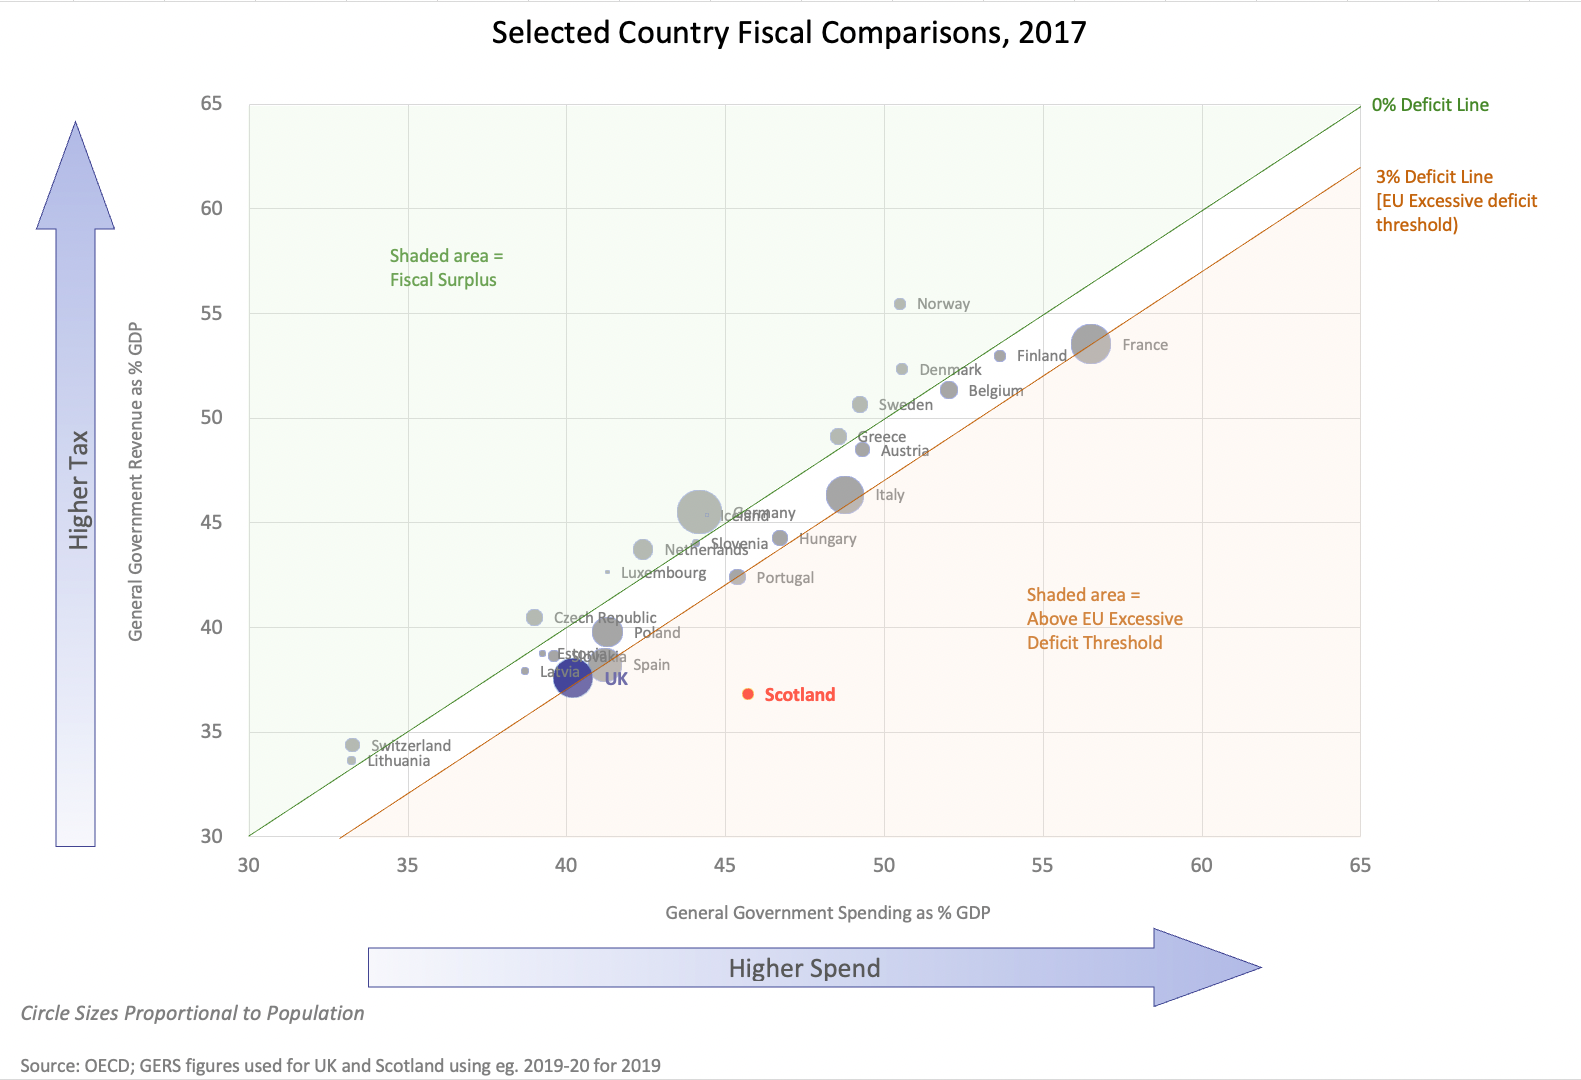
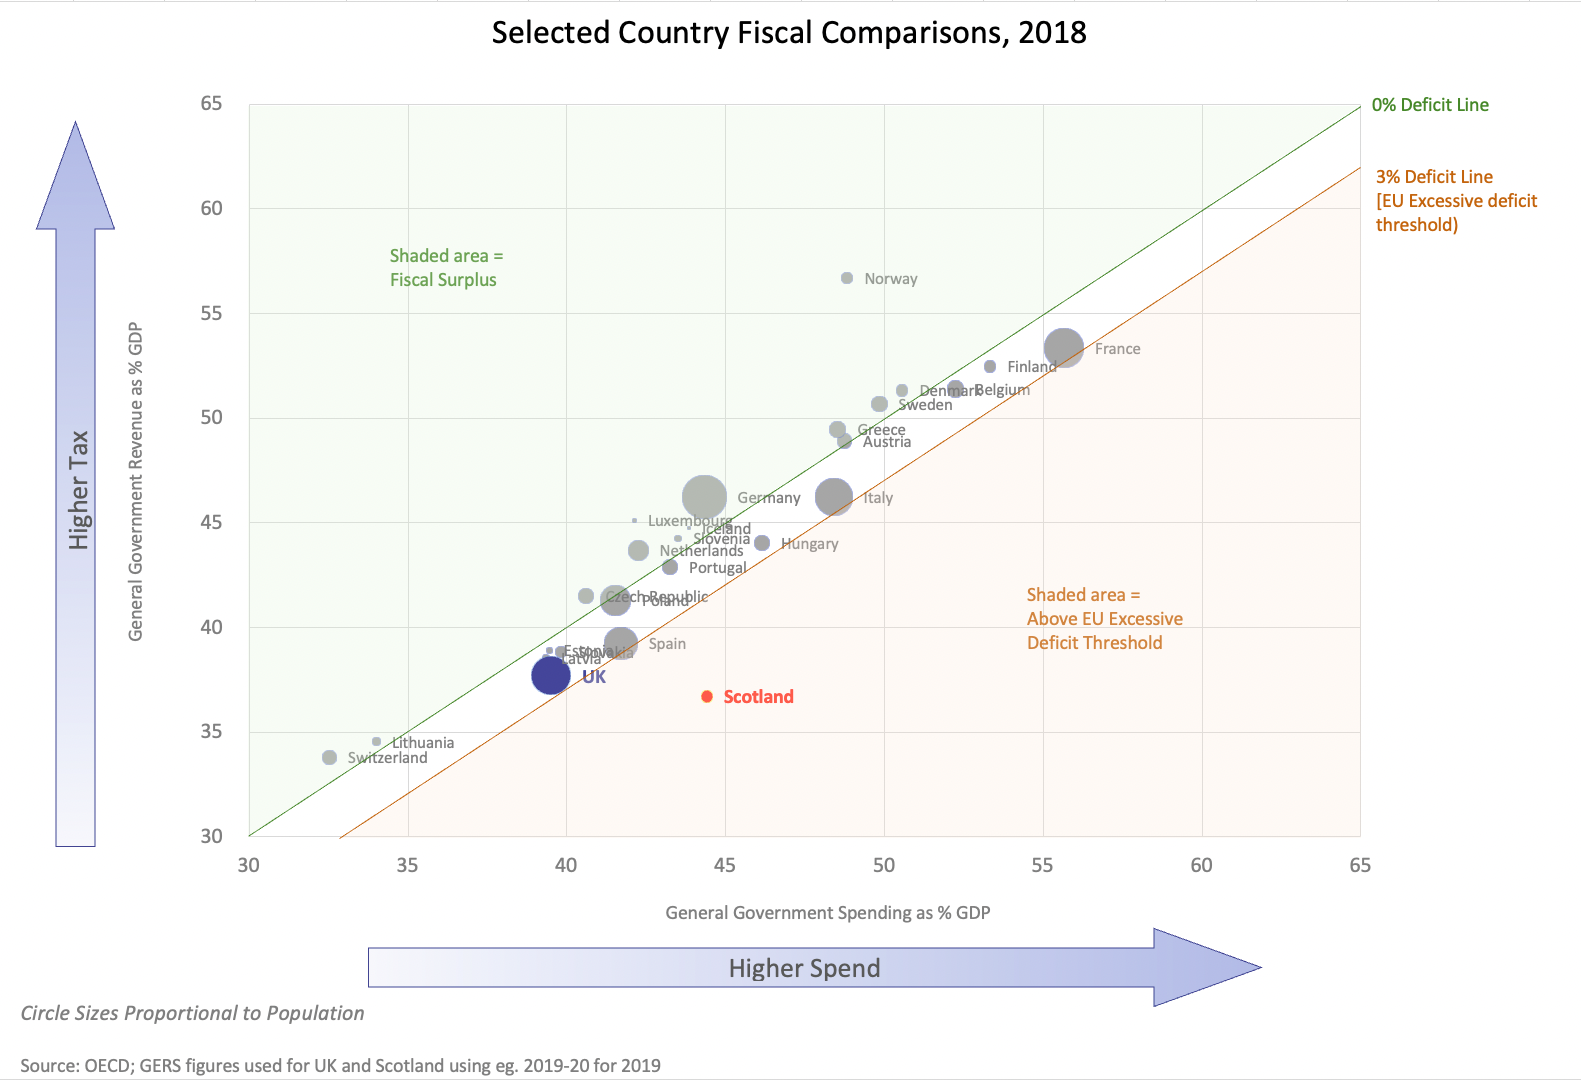
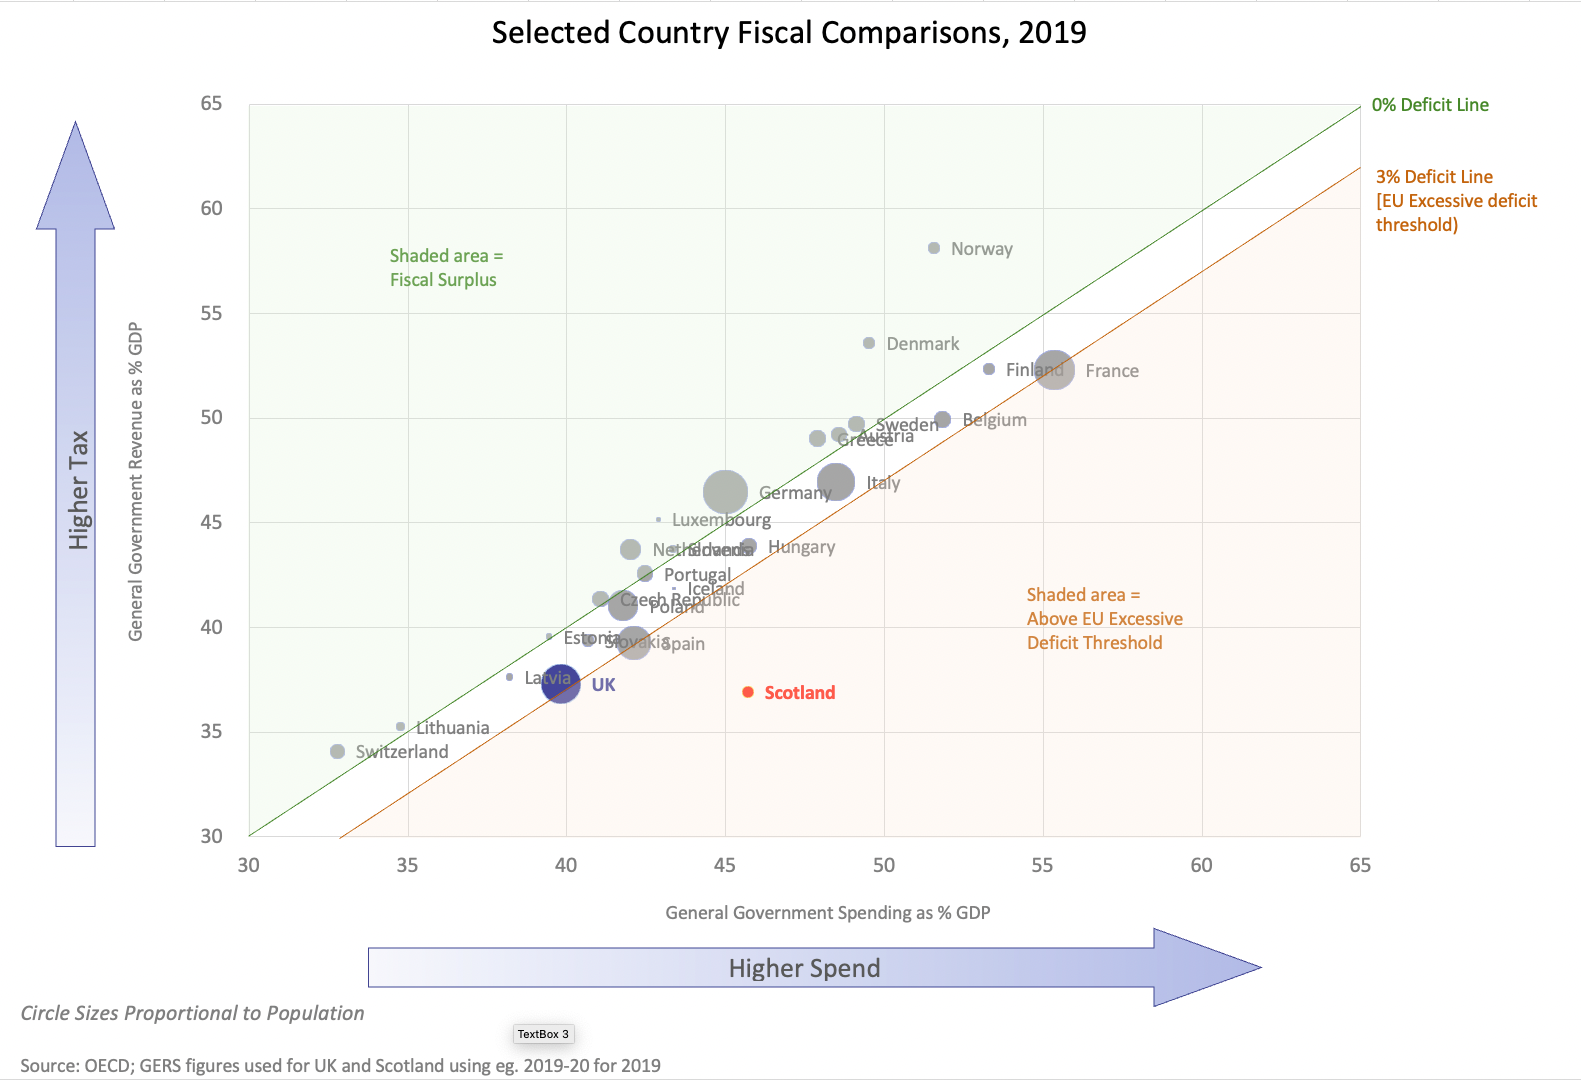
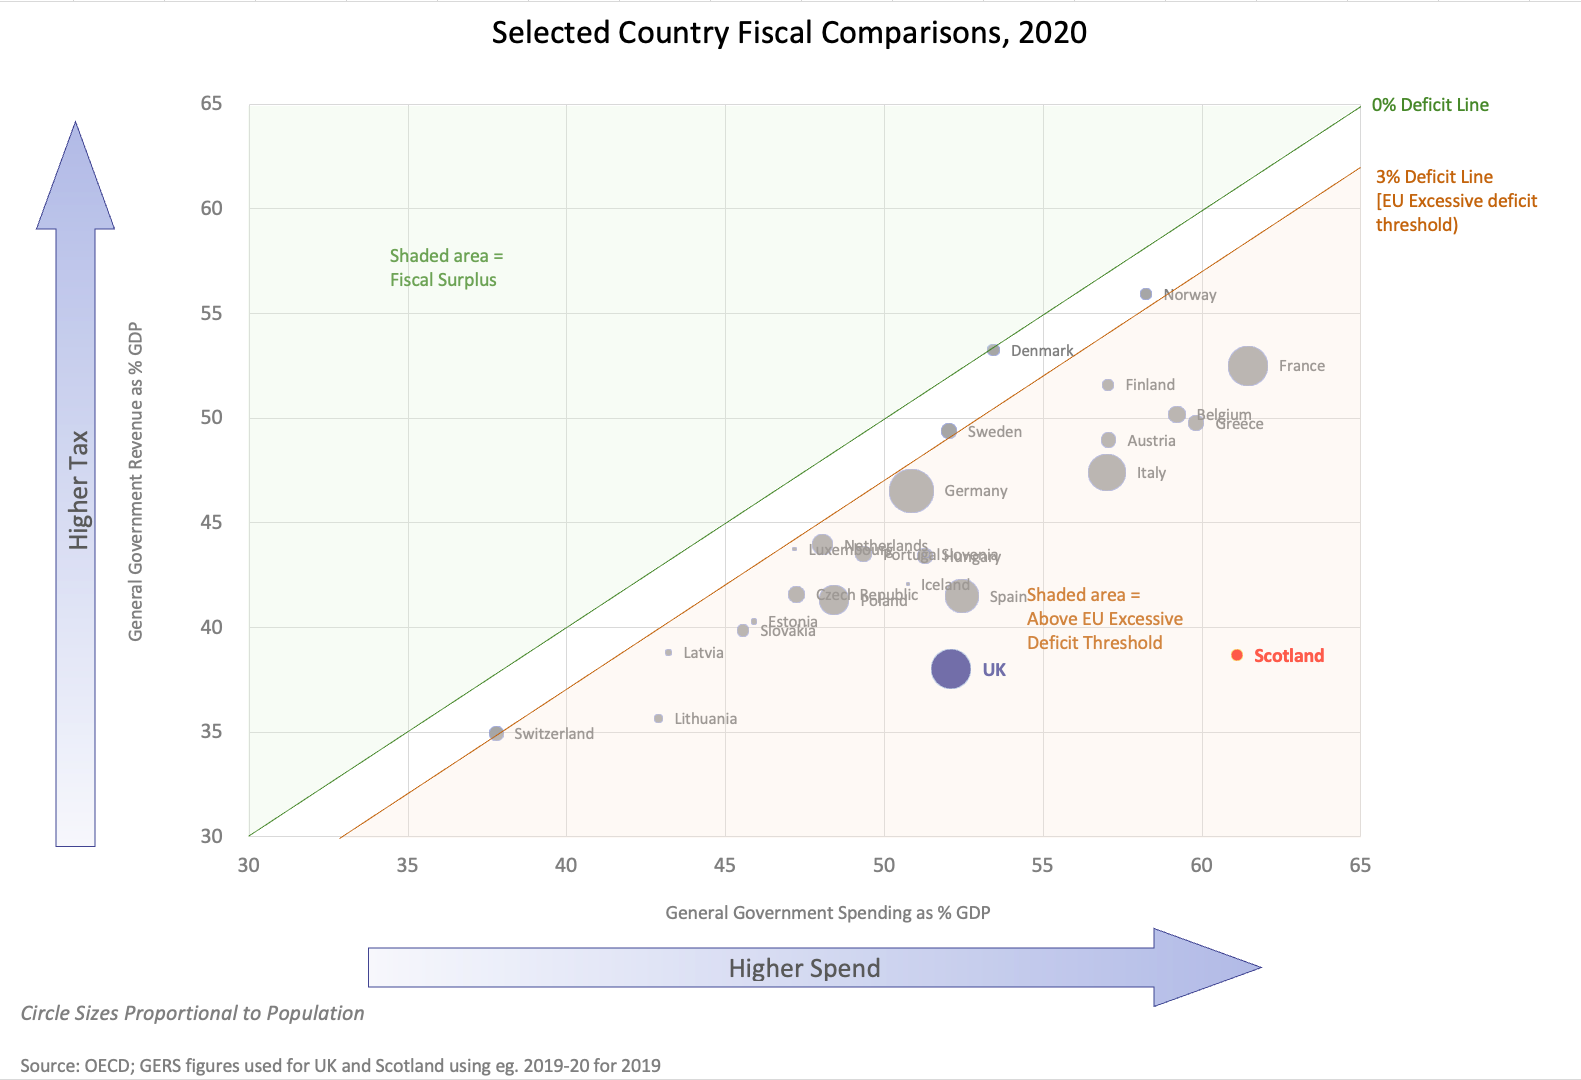
This wider view merely reinforces the observation that Scotland (in the UK) is an outlier: it consistently benefits from higher spend as % of GDP than any other country with similarly low levels of revenue as % of GDP.
There is also no obvious correlation between country size and fiscal strategy - all European countries are fiscally prudent during normal times and larger countries are equally capable of pursuing higher tax / higher spend fiscal models.
The data used for international comparison comes from the OECD; the UK and Scotland data is taken from GERS (the UK data in GERS reports to a slightly different year-end, but very closely matches that shown by the OECD).
Please log in to create your comment