FISCAL REALITY BITES
10 December 2023
Key Findings
-
These Islands polling has found that 76% of SNP supporters believe that “Scotland sends more to Westminster than it gets back in public spending” and that they consider this claim to be very important to their constitutional view.
-
Unless reserved spending which takes place in Scotland – that is spending on things like pensions and Network Rail - doesn’t count as Scotland “getting back” public spending, this statement is simply not true.
-
This false grievance is highly significant in the context of the independence debate because, were Scotland to separate from the UK, the likely consequences for tax rates and levels of public spending are obvious.
-
When we asked voters how they would vote in an independence referendum if separating from the UK would lead to them having to pay significantly higher taxes and/or would result in lower public spending in Scotland, support for independence dropped from 40% to just 27% – 31% .1Excluding don’t knows, this translates into support for independence dropping from 45% to 33 – 36%
Technical Details
-
Impact of higher Taxes or lower spending on support for independence: Polling of 1,037 Scottish Adults (18+) carried out by Focaldata, fieldwork 6-18 October 2023.
The following link provides access to the data tables for the relevant questions.2Half of those polled were asked the standard Yes/No question near the beginning of the poll and half near the end, so to get the base Yes/No figures the results must be combined from the two questions Q6 and Q24.
These Islands October 2023 Data Tables
-
Belief in the statement that “Scotland sends more to Westminster than it gets back in public spending”: Polling of 1,277 Scottish Adults (18+) carried out by Focaldata, fieldwork 25 August -1 September 2023.
The following link provides access to the data tables for the relevant questions.
These Islands September 2023 Data Tables
Summary
In our last polling report [It's The Way You Ask Them] we highlighted that judging support for Scottish independence by using the traditional Yes/No question favours the “Yes” side (because 12% of those who vote “Yes” explicitly believe that Scotland could be an independent country and “Remain” in the UK).
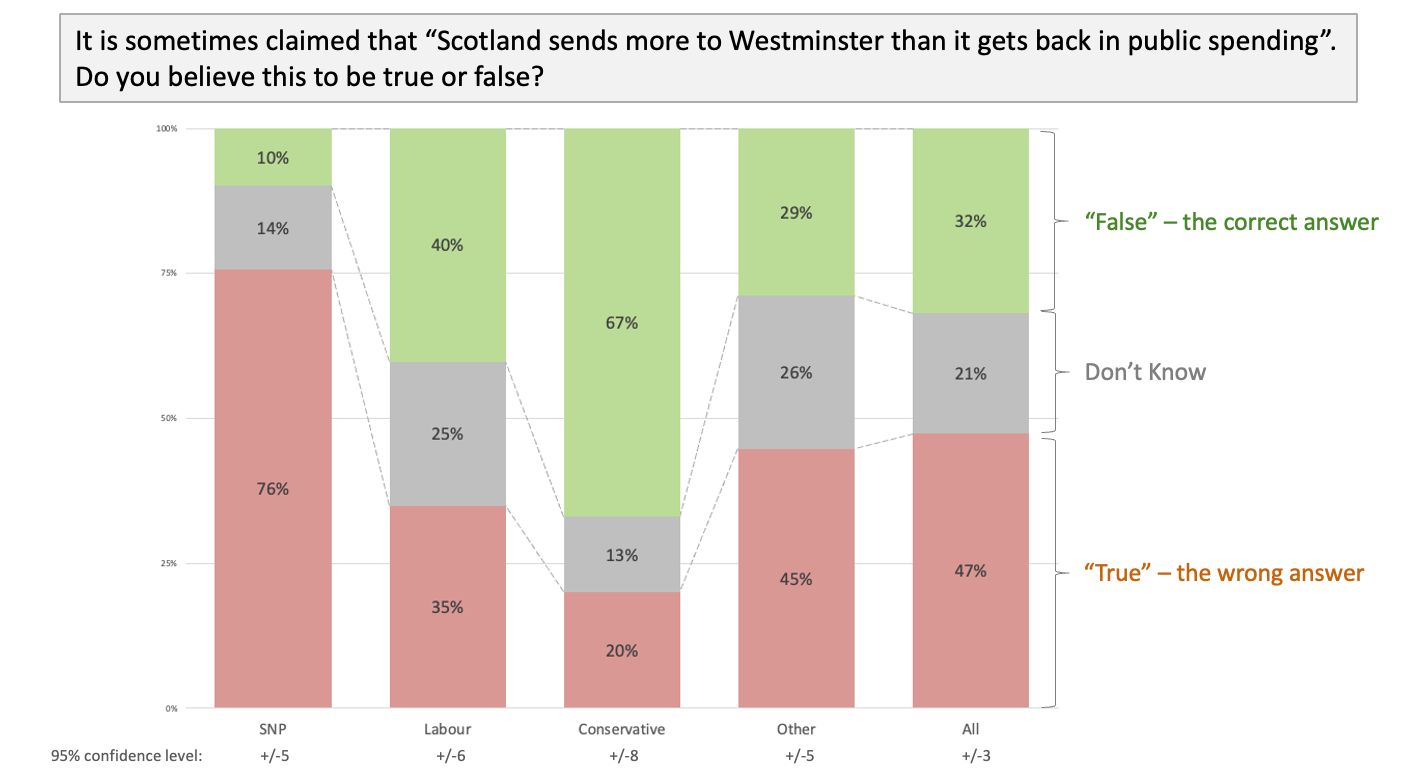
In this report, we identify that that headline "Yes" support relies heavily on a widely held belief that “Scotland sends more to Westminster than it gets back in public spending.” Our polling found that 76% of SNP supporters believe this claim to be true and that they consider this a very important reason for wanting Scotland to be independent.
The problem for Scottish nationalists is that this claim is demonstrably not true. The problem for supporters of the union is that this false grievance is so widely believed, with 47% of the electorate believing it to be true versus just 32% who recognise it as false.
It is not difficult to show that Scotland “gets back more” in public spending than it “sends to Westminster”.3Government Expenditure and Revenue Scotland 2022-23 This is not a debate about alternative timelines, possible future scenarios or what an independent Scotland might choose to do differently. It’s a statement of fact about the fiscal reality under current constitutional arrangements. Put simply: the UK’s system of pooling and sharing allows Scotland to benefit from higher public spending than its current levels of taxation could otherwise sustain.
National Statistics published by the Scottish Government explicitly set out to quantify the difference between “what revenues were raised in Scotland” and “how much was spent on public services for Scotland” . They show that in 2022-23 spending exceeded revenue by £19.1 billion. Over the last decade that average figure has been £21.4 billion; the smallest it has been is £16.4 billion.4In real terms using the UK GDP deflator, figures directly from GERS.
The body of this paper deals comprehensively with the various arguments about how reliable the figures are, how reserved costs are allocated to Scotland in these figures and what assumptions are made about Scotland’s share of the UK’s debt.
But the bottom line is that the only way to justify the claim that “Scotland sends more to Westminster than it gets back in public spending” would be to argue that Scotland doesn’t “get back” £33 billion5In 2022-23 total reserved spending for Scotland excluding allocated debt interest and international services, £0.8bn of allocated defence spending and £0.3bn as the (net) amount spent in rUK but charged to Scotland in GERS = £32.8bn of reserved expenditure that currently takes place directly in Scotland on things like: Pensions and other social protection; regular forces and MOD civilian personnel; defence spending with industry; HMRC, DWP, FCDO and Ofgem employees in Scotland; Network Rail; Covid-19 recovery funding; R&D tax credits, research & innovation funding; BBC spending in Scotland; Border Force; Homeland Security; British Transport Police; nuclear decommissioning costs; Lottery grants; Broadband funding, research councils, training boards, UK Space Agency, Kickstart and much more.
This current fiscal reality is central to the independence debate because it has clear implications for taxation and public spending were Scotland to separate from the UK. As the body of this report argues, to achieve fiscal sustainability – particularly while establishing a new currency and trying to meet the EU’s deficit criteria – a fiscally independent Scotland would inevitably need to increase taxes and/or cut public spending versus current levels. That is what normal independent countries do (and it’s something the SNP’s own Growth Commission accepted in 2018).6https://www.these-islands.co.uk/publications/i307/gc_5_the_truth_about_austerity.aspx
Our latest poll therefore asked respondents how they would vote in a Yes/No independence referendum “If Scottish independence would mean you would have to pay significantly higher taxes” or “If Scottish independence would result in significantly lower public spending in Scotland (on things like health, education, and social welfare)”.
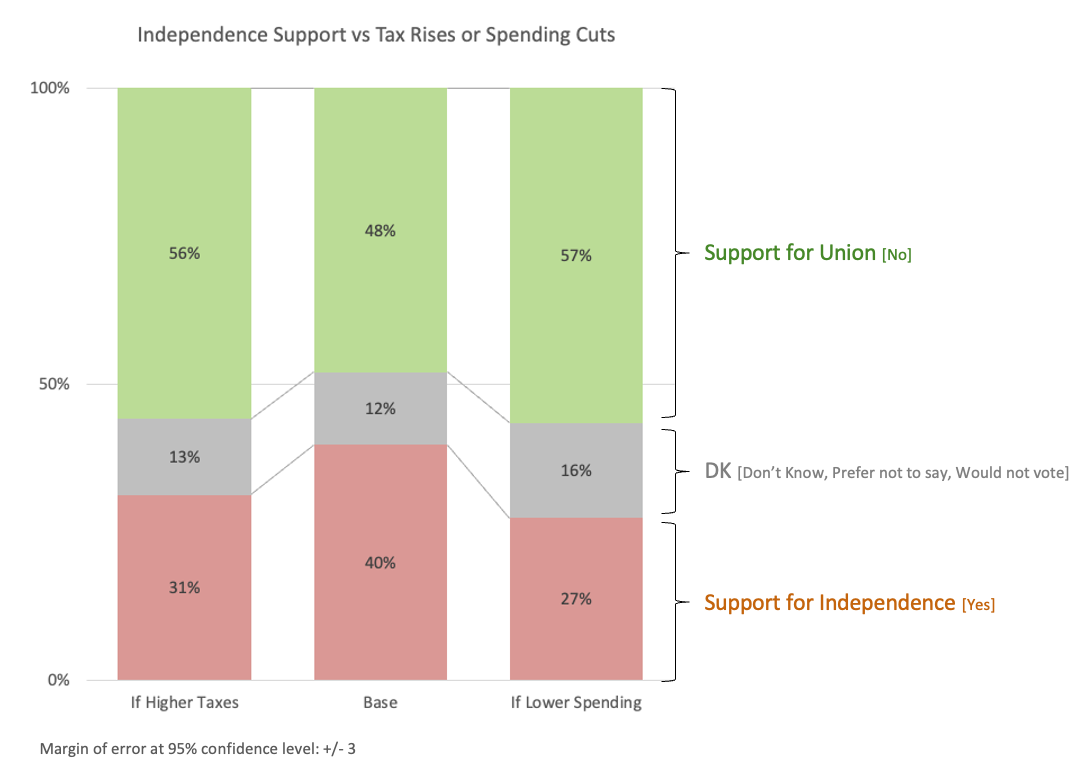
We found that if voters understood separation from the UK would lead to them paying significantly higher taxes or result in lower public spending in Scotland, support for independence would drop from 40% to just 27 - 31%.
Perhaps this is why those campaigning for independence don’t like to engage in detailed discussions about taxation and public spending in an independent Scotland: they realise how much “Yes” support would not survive contact with fiscal reality.
The False Grievance
Our polling shows that 76% of SNP supporters7Based on UK General Election voting intention, August 2023 believe that “Scotland sends more to Westminster than it gets back in public spending".
When asked how important this belief is to their view on independence, SNP supporters typically scored it as 10 out of 10.
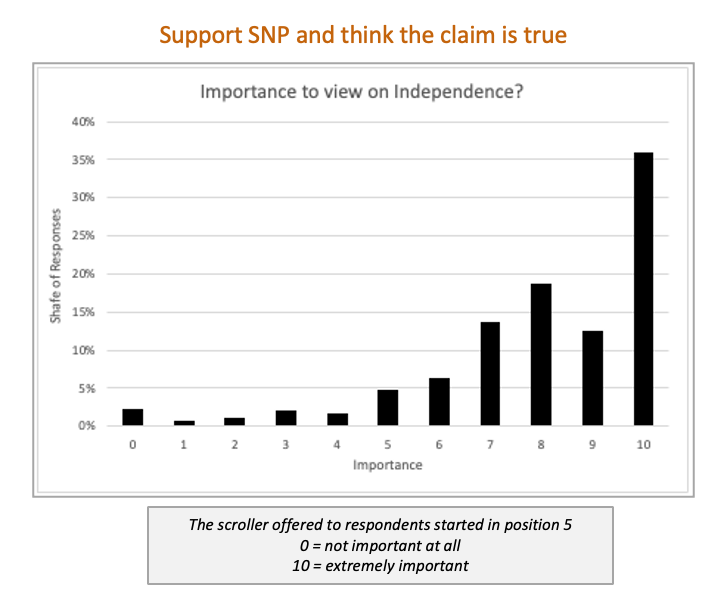
We should recognise that for many this belief may be an effect of supporting independence rather than a cause. But there can be no doubt that this misunderstanding is both endemic amongst independence supporters and that they consider it highly significant to justifying their constitutional view.
The problem for Scottish nationalists is that this belief simply isn’t true. The problem for supporters of the union is that this belief is so widely held, with 47% of the electorate believing it to be true vs just 32% who recognise it as false.
Any credible analysis of taxes raised by Scotland and public spending for Scotland must start with the Scottish Government’s own Government Expenditure and Revenue Scotland (GERS) report. Those who question the integrity of the team in St Andrew’s House, Edinburgh who compile these figures do not deserve to be taken seriously (for completeness, an appendix to this document deals with the most common misconceptions relied upon by these “GERS-deniers”).
These GERS figures show that over recent decades Scotland has benefitted from being part of the UK’s model of fiscal pooling and sharing; money spent on public services for Scotland is very significantly higher than revenues raised in Scotland. This should not be a controversial observation.
Decisions around reserved spending may take place in Westminster, but nobody can reasonably suggest Scotland doesn’t “get back” the reserved spending that takes place in Scotland or that Scotland doesn’t get value from sharing parts of the UK’s machinery of state.
Understanding the Numbers
To give a reasonable sense of perspective, we’ll start by looking at the most recent 10 years’ worth of data.
A good starting point is to look at the difference between revenues raised by Scotland (with and without North Sea revenues)8All of the figures used in this report refer to the “geographic share” calculation of North Sea revenues attributable to Scotland, a calculation which typically allocates c.90% of N Sea revenues to Scotland. less devolved spending (ie. spending fully controlled by the Scottish Government).9The figure used here uses the devolved spending number in GERS. Although not material to this debate, it’s worth noting that this excludes £0.1bn of Scottish Government costs which are allocated to the rest of the UK in GERS: 29% of SG ferries costs (£71m in 2021-22) and 12% of SG spending on Creative Scotland, Royal Botanic Gardens etc (£50m in 2021-22).
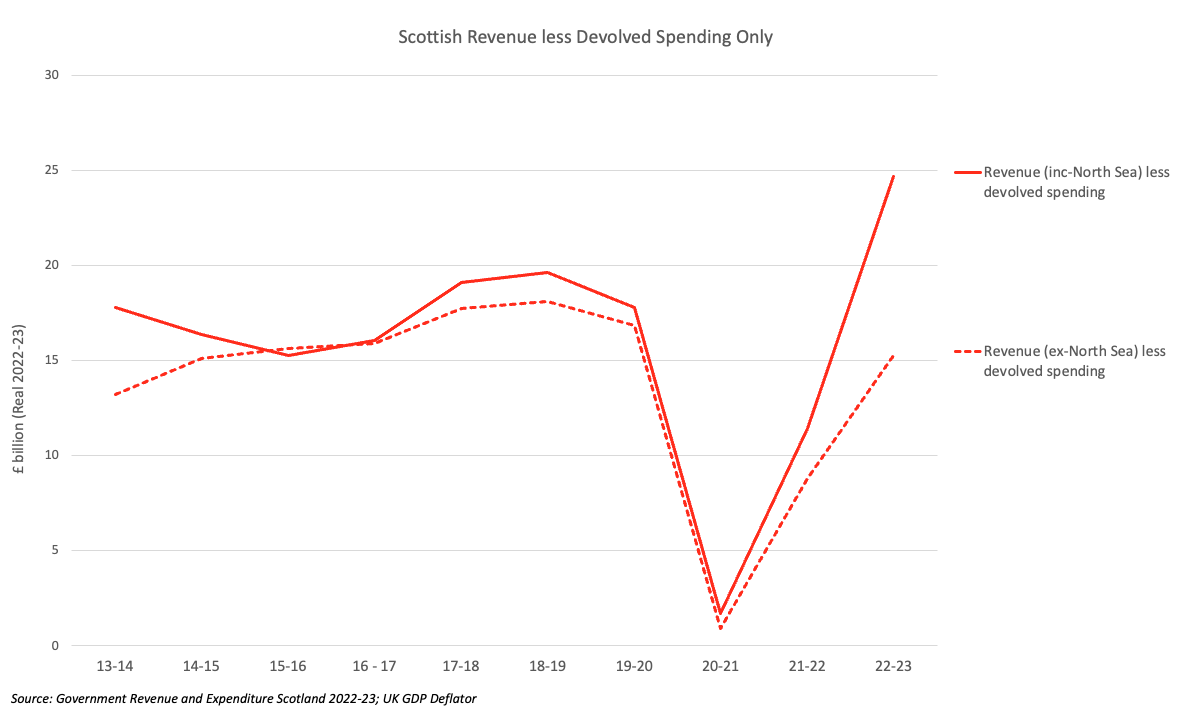
This graph shows that revenues raised in Scotland more than cover devolved spending (aka the Scottish Government’s budget) and clearly shows the impact of the pandemic in 2020-21. Last year the lines diverge because higher oil & gas prices have driven higher North Sea profits and hence higher North Sea tax revenues (further supplemented by the Energy Profits Levy).
If we stopped the analysis here it might look like Scotland does indeed “send more to Westminster” more than it “gets back” in public spending. But to do so would be to ignore all reserved (controlled by Westminster) expenditure that takes place in and for the benefit of Scotland.
The following graph puts reserved (controlled by Westminster) spending allocated to Scotland in the Scottish Government’s GERS report in context.
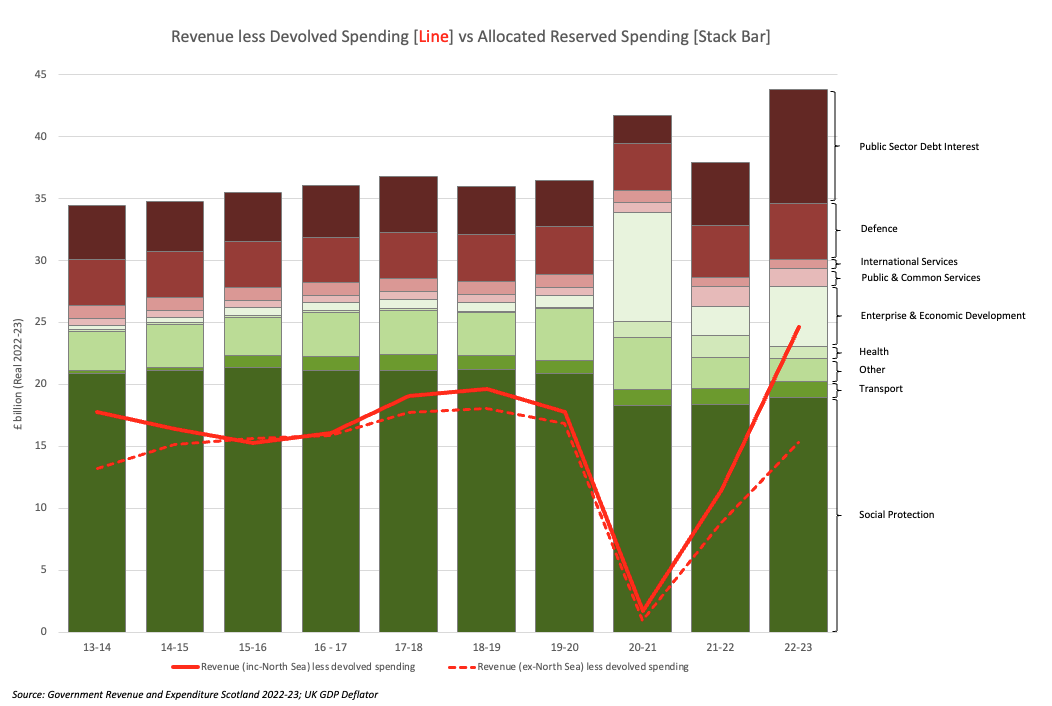
The extent to which the stacked bars are higher than the red line is the scale of Scotland’s GERS deficit.
To understand why Scotland clearly benefits from the UK’s system of pooling and sharing, we need to dig into the detail of what lies behind each of these reserved cost allocations. There is no short-cut to understanding.
The categories shaded in green relate almost entirely to spending that takes place in Scotland (very minor exceptions are footnoted, the net effect of which is immaterial):
-
Social Protection: This relates to State Pension, Universal Credit, Housing Benefit, other DWP administered social security plus HMRC administered child benefit and tax credits.10These include a per capita allocation of DWP delivery costs (£166m in 2022-22) and overseas pensions costs (£363m in 2021-22). Given that 9.4% of DWP employees are based in Scotland, it is likely that more is spent in Scotland than allocated to Scotland in GERS. It is also of course the case that an independent Scotland would need its own DWP function (and would presumably continue to pay expat Scots’ pensions). [The figure drops in 20-21 because that was when additional responsibility for benefit spending was devolved].11Under the Scotland Act 2016 further specific social security powers were devolved to the Scottish Government – between 19-20 and 20-21 this led to £2.9bn being transferred from reserved to devolved spending, most notably: Personal Independence Payment (£1.3bn), Disability Living Allowance (£0.8bn), Attendance Allowance (£0.5bn) and Carers’ Allowance (£0.3bn)
-
Transport: This figure is dominated by the cost of Network Rail in Scotland12In 2021-22, 85% of these costs relate to Network Rail (the public body responsible for the operation and maintenance of Scotland’s rail infrastructure). but also includes costs associated with the Maritime & Coastguard Agency.13Scotland’s population share of the net cost of DVLA is also included, but as DVLA charges drivers for its services this is only a small net cost (£9m in 2021-22) For the avoidance of doubt: nothing is included for infrastructure costs outside Scotland (such as HS2, Crossrail etc).
-
Other: This covers a wide array of costs, the vast majority of which relate to activity which takes place in Scotland.14This figure also includes Accounting Adjustments (which explain the significant drop in “other” in 2021-22). As explained in GERS (p8): “Accounting adjustments are used to present revenue and expenditure on a National Accounts basis [..] In general, these adjustments do not affect the net fiscal balance or current budget balance, as they are added to both revenue and expenditure. In 2020-21, accounting adjustments added £7.4 billion to the estimate of Scottish public sector revenue and £8.4 billion to the estimate of Scottish public sector spending, with the difference being due to coronavirus expenditure included in the accounting adjustments.” These include but are not limited to costs associated with research and innovation spending, research councils, Technology Strategy Board, the BBC15In 2021-22 £310m was allocated for the costs of the BBC compared to £241m spent producing programmes in Scotland according to the BBC’s annual report https://www.bbc.co.uk/aboutthebbc/documents/ara-2022-23.pdf, Lottery grants, Broadband funding, nuclear decommissioning16This is a population share allocated figure which is very similar to the “in Scotland” costs used in the Treasury’s Country and Regional Analysis report (£272m vs £282m in 2021-22)., Renewable Heat Incentive17£189m in 2020-21, Kickstart, training boards, Ofgem18Scotland is allocated an £8m population share of Ofgem costs, but 43% of Ofgem employees (580 out of 1,350) are based in Scotland., UK Space Agency, etc. This category also includes allocations for reserved Public Order and Safety costs (Border Force, Immigration Enforcement, Asylum & Protection Group, National Crime Agency, HMCTS, Homeland Security, British Transport Police etc.) - these are mostly allocated on a simple population share basis, but include money spent in Scotland and relate to functions an independent Scotland would require.19In 2021-22 £320m was allocated to Scotland for reserved Public Order and Safety functions (of which £196m relates to Home Office costs, the balance to National Crime Agency, British Transport Police, etc.). A material proportion of this spending already takes place in Scotland (for example, there are over 1,100 Home office employees based in Scotland) and an independent Scotland would clearly need these functions. Whether the value delivered by these functions could be recreated by an independent Scotland for just 8.2% of the UK’s costs as allocated in GERS is highly debatable.
-
Covid-19 Recovery: The two categories of Health and Enterprise & Economic Development are dominated by Covid-19 recovery spending (which explains the dramatic increases in recent years). The latter category also includes R&D tax credits and other targeted tax reliefs which directly benefit businesses in Scotland.
The categories shaded in burgundy are those entirely20Across these four categories, 99% of spending allocated to Scotland in GERS is on a population share basis. allocated on a simple population-share basis:
-
Defence: Approximately 75% of this figure (ie. £3.0bn of the total £4.0bn) relates to the over 14,000 regular forces and MOD civilian personnel based in Scotland as well as MOD spending with industry in Scotland.21Total UK personnel costs in 2021-22 were £13.4bn of which 8.2% allocated to Scotland = £1.1bn. 7.3% of UK regular forces and MOD civilian personnel are located in Scotland [https://www.gov.uk/government/statistics/location-statistics-for-uk-regular-armed-forces-and-civilians-2022] implying on a pro-rata basis a difference between “in” and “for” of just £0.1bn less. MOD spending with industry in Scotland in 2021-22 was £2.0bn out of a total spend with UK industry of £21.1bn - so at 9.5% that’s £0.3bn more than the population share allocated to Scotland in GERS. https://www.gov.uk/government/statistics/mod-regional-expenditure-with-uk-industry-and-supported-employment-202122/mod-regional-expenditure-with-uk-industry-and-commerce-and-supported-employment-202122 The population share of UK spending figure used in GERS implies Scotland is consistently spending 2.0% of GDP on defence, in line with the NATO membership commitment.22Over the last 10 years the figure varies between 1.8% and 2.2% and averages to 2.0%. This is in line with the commitment made by NATO members - https://www.nato.int/cps/en/natohq/topics_67655.htm Depending on the view taken with regards NATO membership and overseas defence spending, an independent Scotland may choose to spend less on defence spending, but without impacting spending in Scotland this would necessarily be a “saving” of less than £1bn.23In 2018 the SNP’s Sustainable Growth Commission suggested (without any supporting explanation) that an independent Scotland could save 0.4% of GDP by reducing spending on defence compared to the amount allocated in GERS, an implied saving of £0.8bn.
-
Public & Common Services: The largest ongoing Public & Common Services cost is Scotland’s 8.2% share of UK HM Revenue and Customs costs (£404m in 2021-22). We know that 10.9% of HMRC employees are based in Scotland24https://www.gov.uk/government/statistics/civil-service-statistics-2022/statistical-bulletin-civil-service-statistics-2022, so this allocated for cost is likely to be less than the amount spent in Scotland (and an independent Scotland would clearly require its own Revenue & Customs functions). The other main ongoing costs included in this figure relate to the Cabinet Office (£165m in 2021-22), Houses of Commons and Lords (£68m) and Core Treasury Costs (£30m) which are costs incurred outside Scotland.
[This figure has risen in recent years because it includes a share of exceptional HM Treasury costs related to the EU Withdrawal Agreement Financial Settlement. That figure almost exactly matches Scotland’s previous share of the UK’s net contribution to the EU so, in narrow fiscal transaction terms, the current GERS impact of leaving the EU is neutral.]25By interrogating the GERS expenditure database, we can see that in 2021-22 (the most recent year for which detailed data is available) £0.7bn was allocated as Scotland’s population share of the EU withdrawal agreement financial settlement (a similar figure is implied in the 2022-23 numbers). In the two years prior to 2021-22, Scotland’s share of EU transactions averaged out to a cost of £0.8bn pa.
-
International Services: Most of this figure (65%) is foreign economic aid. We are unaware of any nationalists arguing that an independent Scotland would reduce this commitment. The balance relates to Foreign, Commonwealth and Development office costs. There are 830 FCDO staff based in Scotland (15% of the UK total) and it would be hard to argue that the value Scotland gets from the UK’s international diplomatic and trade network is less that the 8.2% of the UK’s costs allocated in GERS.
-
Public Sector Debt Interest: In the past some nationalists have attempted to argue that Scotland shouldn’t assume any share of responsibility for the UK’s debt. That has always been at best a questionable position, but in the wake of the UK Government’s pandemic response it’s hard to believe anybody would still attempt to make this case. A more reasonable position - as adopted by the SNP in 2014 and taken by their Sustainable Growth Commission in 2016 - is that Scotland should assume its population share of the UK’s debt. This is the implicit assumption made by the Scottish Government’s own Chief Statistician and Chief Economic adviser in the GERS report, where a population share of the UK’s debt interest costs is allocated to Scotland.
That is unavoidably a lot of detail to digest. But it’s important detail because it shows us that the reserved costs shown in GERS relate to real-world expenditure which directly benefits the people of Scotland and the Scottish economy. No amount of quibbling about estimates or allocations can change that material reality.
These Islands’ own line-by-line analysis suggests that – excluding debt interest, defence and international services – the difference between spending allocated for Scotland in GERS and spend which takes place in Scotland is less than £0.5bn.26For 2019-20 we calculated this figure at a line-by-line level detail as being £0.3bn, that being the net effect of what we estimate to be £0.6bn of spending allocated to Scotland in GERS but which takes place in in the rest of the UK [Home Office, Cabinet Office, DCMS, DBEIS, DfT, MoJ, HM Treasury, DEFRA, NCA, DIT related costs plus BBC costs over and above those spent in Scotland plus House of Commons, House of Lords costs] less spending that takes place in Scotland but is not allocated to Scotland in GERS of £0.3bn [the actual spend on HMRC, DWP and Ofgem employees in Scotland over and above the 8.2% share of UK costs allocated in GERS plus ferries costs and Creative and Historic Scotland costs which are partially recharged to the rest of the UK in GERS]
Our analysis is consistent with information released by the Scottish Government in response to a Freedom of information Request asking about work that had been carried out into the difference between in vs for spending in GERS. Whilst advising “against drawing any conclusions or quoting any figures from the draft as the analysis is incomplete” the work-in-progress draft findings were that – excluding defence, debt interest and international aid – “for the range of Government departments considered so far, spending ‘for’ Scotland and spending ‘in’ Scotland are broadly similar”. Whilst explicitly recognising that “the estimates of spending in Scotland are thought to be an underestimate at this time” as they “do not include analysis of spend such as procurement” the working figures showed less than £0.6bn as the difference between spend in and spend for Scotland (excluding Scotland’s population share of UK overseas pensions costs).
It’s worth looking at the chart again. Even if we were to ignore debt interest, take £0.8 billion off allocated defence spending and generously assume away an estimated £0.5m as the difference between for and in Spending (an extreme assumption, as it assumes Scotland gets no value from this activity), Scotland would obviously still be “getting back” far more than it sends to Westminster.
Those who contest whether Scotland benefits from UK-wide pooling and sharing sometimes argue that Scotland doesn’t “get back” spending that exceeds the revenue it generates because that spending is funded by “debt raised on Scotland’s behalf”.
The problem with this argument is that nobody suggests Scotland’s share of the UK’s debt should increase by the amount of its GERS deficit. As explained above, the working assumption is that Scotland assumes responsibility for only a population share of the UK’s debt (hence a population share of the UK’s deficit, which cumulatively creates that debt).
That means that - to be fair and consistent - we must recognise that Scotland is only“getting back more than it sends” if the observed GERS deficit exceeds its population share of the UK’s deficit.
This can be thought of like splitting a bill equally in a restaurant: if your meal cost more than the average then your “bill per head” is higher than the group’s average “bill per head” and you benefit from sharing the bill equally among your fellow diners by assuming only an average “per head share” of the bill. The other diners provide you with an effective financial transfer equal to the difference between the average bill and what your individual bill would have been.
To illustrate with the most 2022-23 GERS figures:
-
Scotland’s deficit (the amount of the UK’s deficit Scotland is responsible for) is £19.1bn.
-
Scotland’s 8.2% per capita share of the UK’s £132.1 billion deficit is £10.8bn.
-
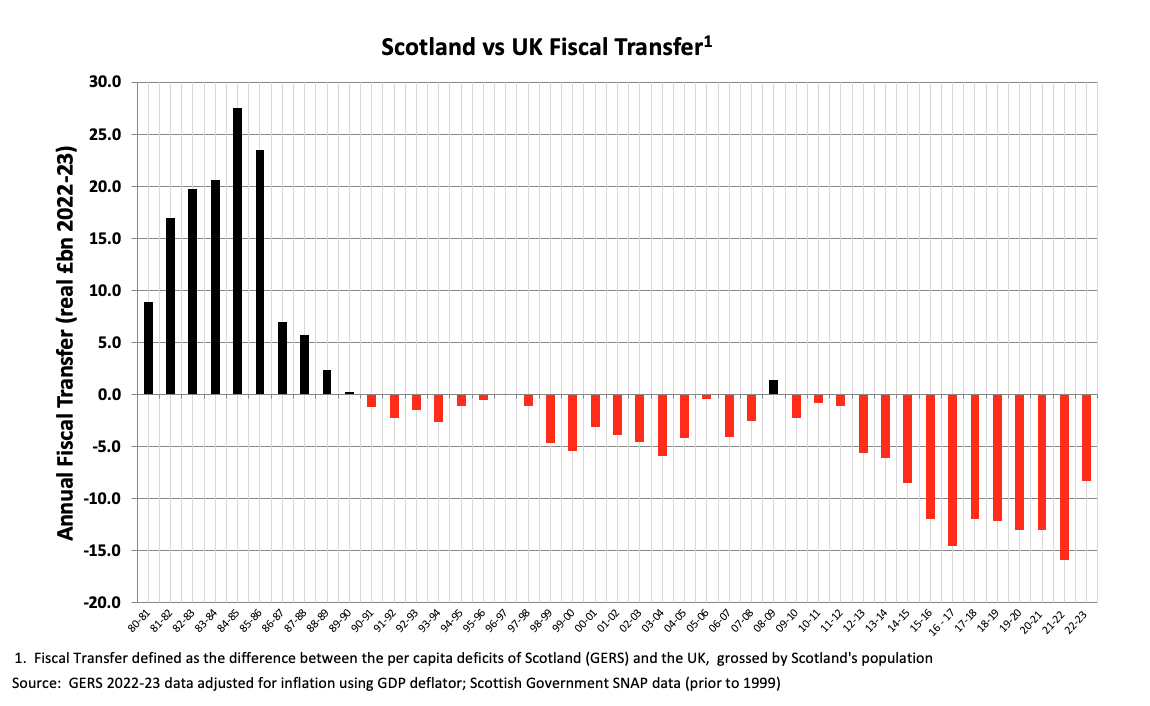
The benefit to Scotland from pooling & sharing tax revenues and assuming just a population share of the UK’s debt liability is therefore just the difference between these figures: £8.3 billion. This figure is sometimes referred to as the implied Fiscal Transfer between the rest of the UK and Scotland.
The table below summarises these figures over the last 10 years. Two versions of the “Fiscal Transfer” are calculated. The first of these accepts that Scotland assumes a population share of the UK’s debt and is the one we would argue should be used. Simply to illustrate that it doesn’t change the answer either way, the second calculation shows the fiscal transfer if Scotland does not assume any responsibility for the UK’s debt (in which case - as Scotland would be incurring no debt liability to fund its deficit - the full deficit before interest costs would be the fiscal transfer).
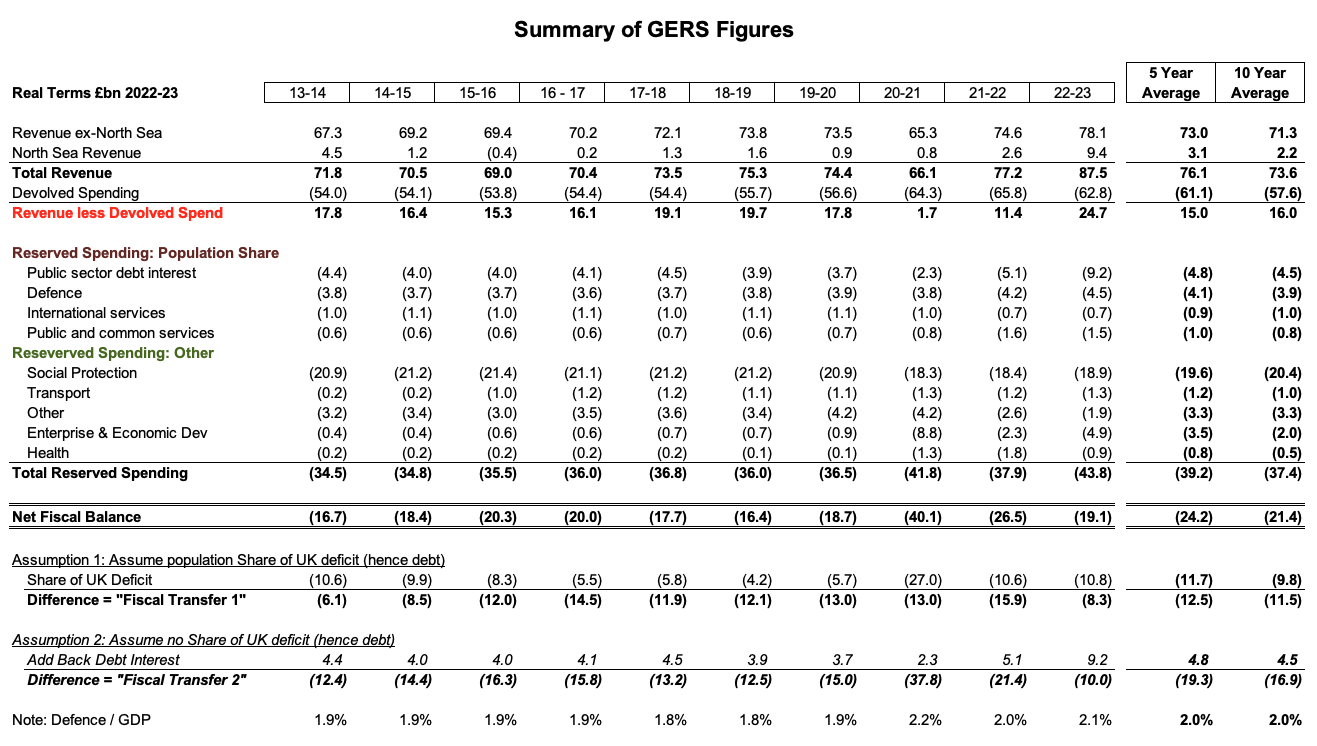
That’s a lot of detail to understand, but the net result is clear. To justify the claim that Scotland has "sent more to Westminster” than it has benefitted from in public spending, somebody would need to demonstrate that the Scottish Government’s own GERS figures have over-allocated costs and/or under-reported revenue to the tune of at least £8bn and on average more than £11bn pa over the last 5 or 10 years. Anybody who has taken the time to understand the true nature of the reserved costs allocated to Scotland in GERS must recognise that this is simply not credible.
None of this is to say that an independent Scotland’s fiscal accounts would be the same as those we see today as an integral part of the UK. Not only could an independent Scotland choose to make different choices in policy areas currently reserved to Westminster, but having to launch and stabilise a new currency while getting on track to meet the EU’s strict deficit criteria would mean the Scottish Government would have to make difficult tax and spend decisions which the current fiscal settlement insulates it from.
But believing “Scotland sends more to Westminster than it gets back in public spending” has nothing to do with possible future scenarios or arguments about who is taking the decisions. It is a false grievance about the current fiscal reality, a fiscal reality that has existed for decades.27See Appendix 1 If we are to have an informed debate about Scotland’s constitutional future, this widely held misunderstanding must be addressed.
The Case for Independence
Some people react to this evidence of the annual fiscal transfer in Scotland’s favour by suggesting it somehow shows that being in the UK is damaging Scotland’s economy (because otherwise why would it need that fiscal transfer?)
The simple answer to this is that pooling and sharing within the UK allows Scotland to enjoy higher public spending than its current taxation levels could otherwise sustain.
The chart below places Scotland’s levels of tax, spend and deficit (all as a percentage of GDP) within an international context:28https://www.these-islands.co.uk/publications/i381/we_need_to_talk_about_scotland.aspx [Note: Scotland’s deficit in 2019/20 was 9.0%, the same as the most recent deficit in 2022-23]
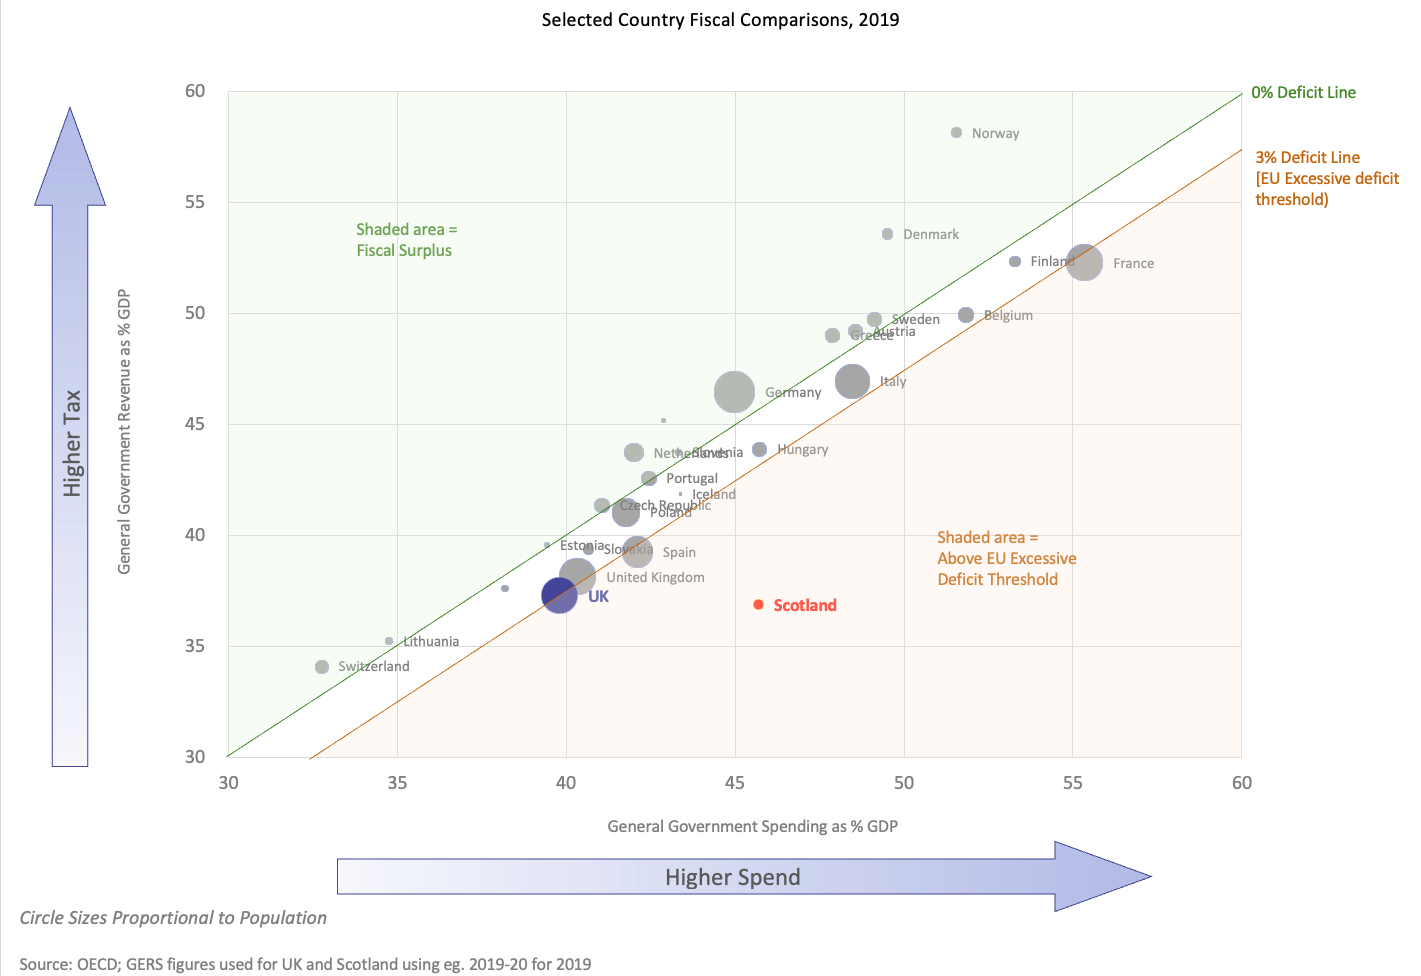
To look like “any normal independent country” Scotland would simply need to increase its taxes or reduce its government spending as a percentage of GDP. This reality is something the SNP’s own Sustainable Growth Commission accepted in 2016 when they concluded that an independent Scotland would need spending growth to lag GDP growth for as long as it would take to achieve fiscal sustainability.29https://www.these-islands.co.uk/publications/i307/gc_5_the_truth_about_austerity.aspx
In our latest poll we therefore asked respondents how they would vote in a Yes/No independence referendum “If Scottish independence would mean you would have to pay significantly higher taxes” or “If Scottish independence would result in significantly lower public spending in Scotland (on things like health, education, and social welfare)”.
In both cases, support for independence fell dramatically:
This suggests that if voters believed Scottish independence would lead to them having to pay significantly higher taxes or result in lower public spending in Scotland, support for independence would drop from 40% to 27 - 31%.30No conclusion can be drawn about the relative persuasiveness of tax versus spend arguments given the +/-3% margin of error. Excluding Don’t Knows that would imply at least a 64:36 lead for “No”.
It appears that roughly 10 percentage points of current headline support for independence would not survive contact with fiscal reality.
Appendix 1: Digging Deeper
To take a longer and more detailed view, it’s helpful to think in terms of revenue and spending per head. Looking at the 2022-23 GERS figures:
-
Scotland generated £696 more revenue per person than the UK average [GERS Table S.4]
-
Scotland's spending was £2,217 more per person than the UK average [Table S.6]
-
Scotland's deficit per person is therefore £2,217 - £696 = £1,521 greater than the UK average
Multiply that £1,521 per head by Scotland's population of 5.48m and we get back to the implied fiscal transfer of £8.3 billion.
The longer View
The GERS figures go back 24 years, so we can repeat this calculation and see that over that period Scotland benefitted from a Fiscal Transfer in all but one year.
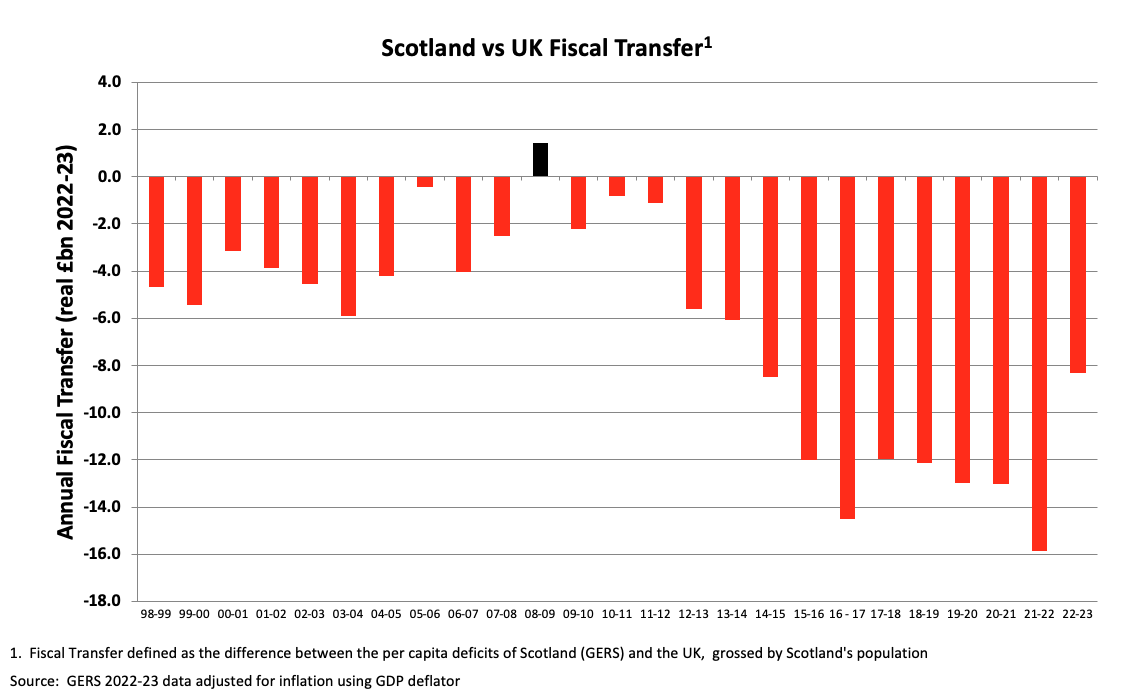
As we will come on to see, the fluctuations are almost entirely explained by volatile North Sea Oil revenues. This explains why the Fiscal Transfer was smaller in 2022-23 than in recent years. In 2021-22 the Fiscal Transfer was £15.9 billion, but since then higher oil & gas prices have driven higher North Sea profits and hence higher North Sea tax revenues, further supplemented by the Energy Profits Levy.
Using experimental data previously published by the Scottish Government it is possible to extend this analysis back to 1980 when North Sea revenues began in earnest. This shows Scotland being a large net fiscal contributor to the UK throughout the 1980s.
Taking a cumulative view from 1980 we can see that it’s only relatively recently that Scotland has become a cumulative net fiscal beneficiary from UK-wide pooling and sharing.
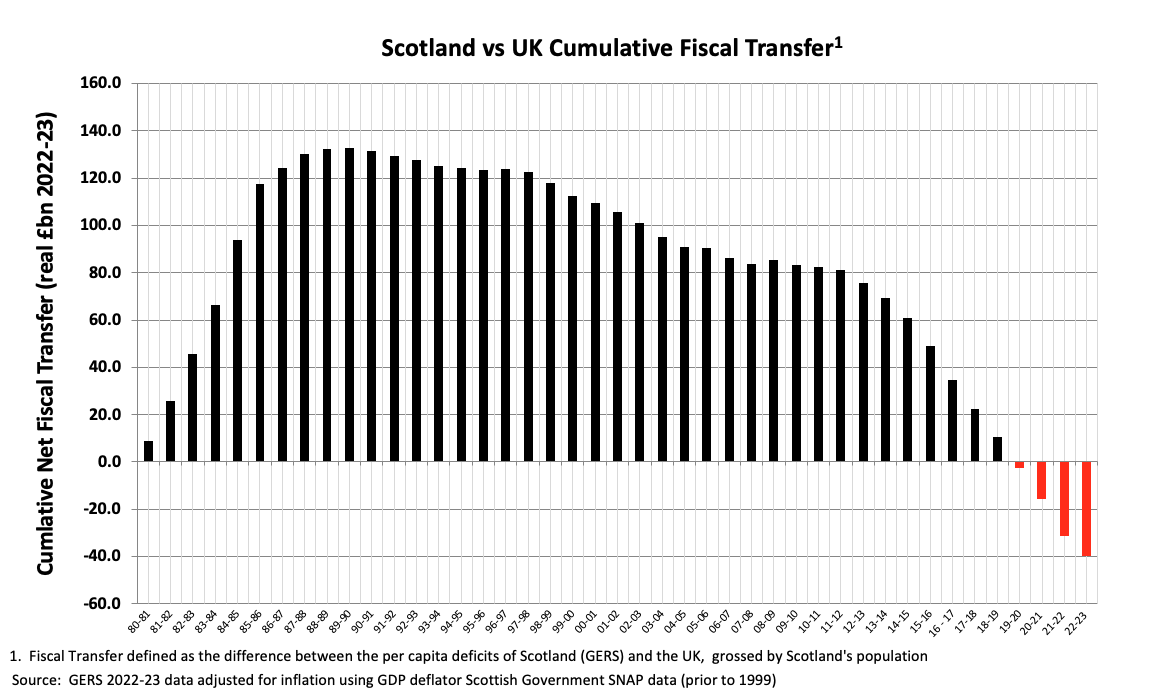
In conclusion: while it certainly hasn’t always been the case, we can confidently say that for the last decade and more Scotland has not been “sending more to Westminster than it gets back in public spending”.
The Deeper View
To better understand why the fiscal transfer exists we need to understand Scotland’s relative performance in terms of both the revenue generated by the Scottish economy and the public spending Scotland benefits from.
The simplest way to understand what’s happening in the GERS figures is to look at Scotland’s share of UK revenue and spending over time compared to Scotland’s share of the UK’s population:
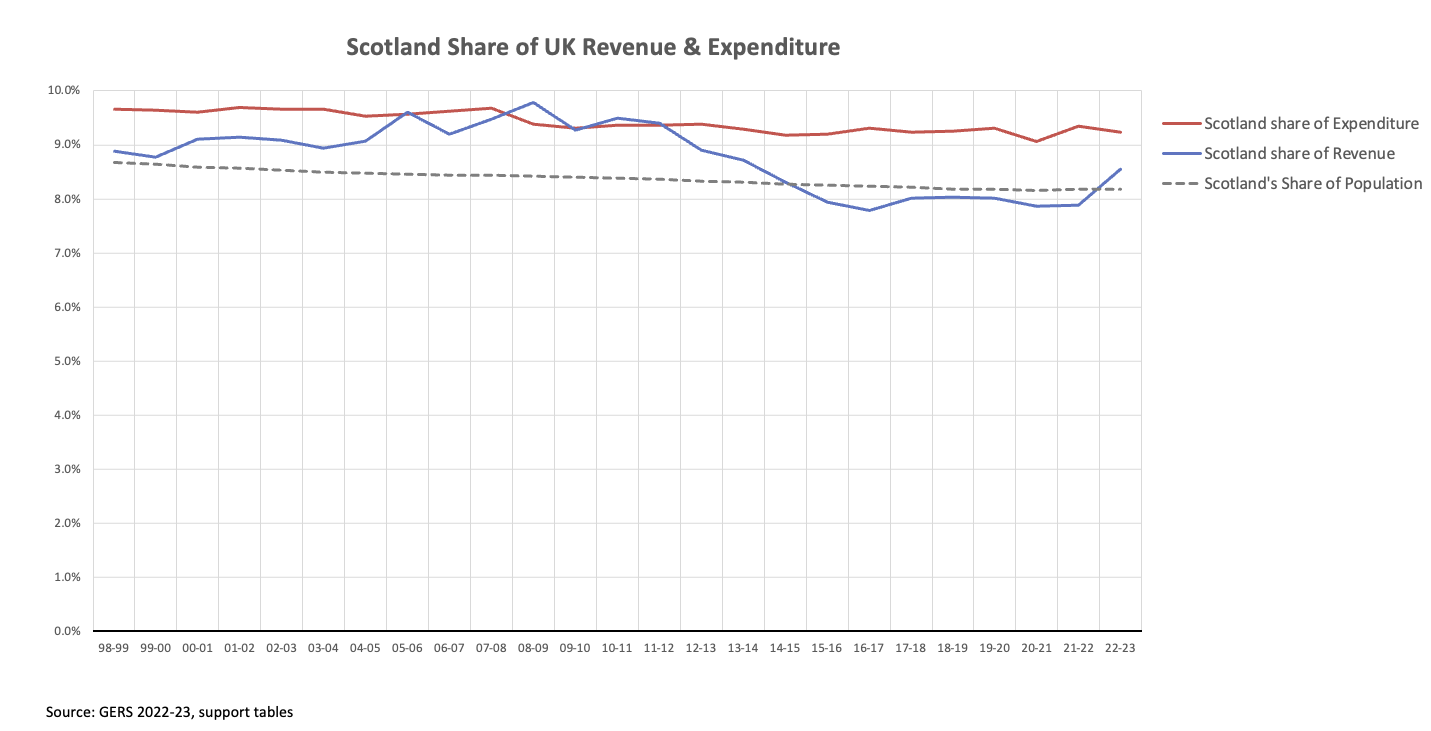
It’s clear that Scotland consistently benefits from a higher than population share of public spending, while sometimes generating a higher than population share of the UK’s revenues. The variability on the revenue side is driven almost entirely by North Sea Oil & Gas revenues. The red line being higher than the blue line shows that Scotland consistently benefits from a higher share of spending than the revenue share it contributes.
Looking first at the revenue side of the equation: what Scotland “sends to Westminster”. The GERS figures show that, before considering North Sea revenues, Scotland’s economy has traditionally generated slightly less revenue per head than the UK average. Inclusion of North Sea revenues shows that in good years for the North Sea, Scotland’s economy has generated higher revenue per head than the UK average.
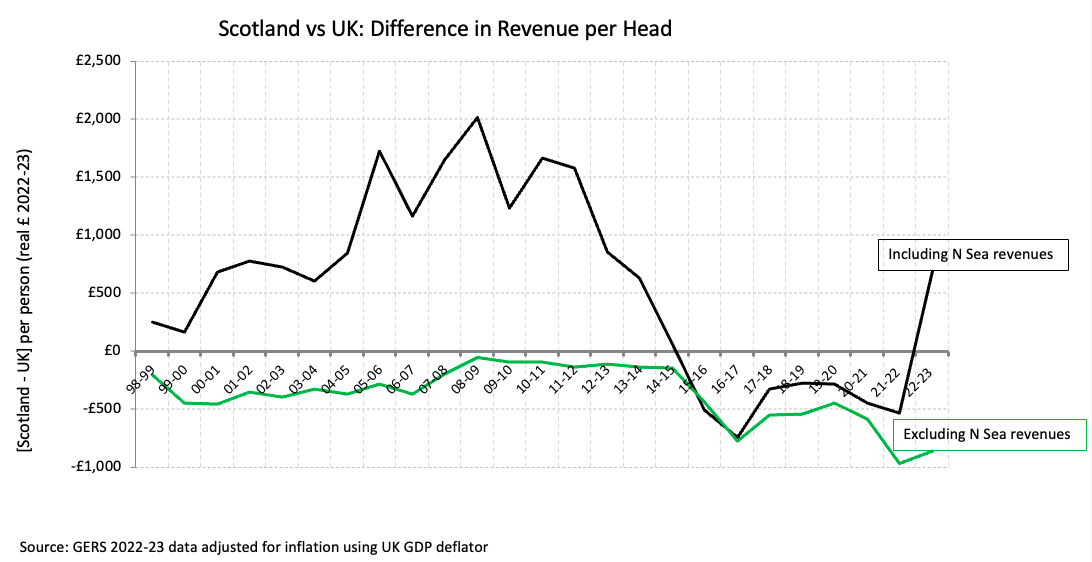
The widening gap in onshore revenue generated per head is almost entirely explained by Scotland’s relatively lower income tax and NIC receipts.
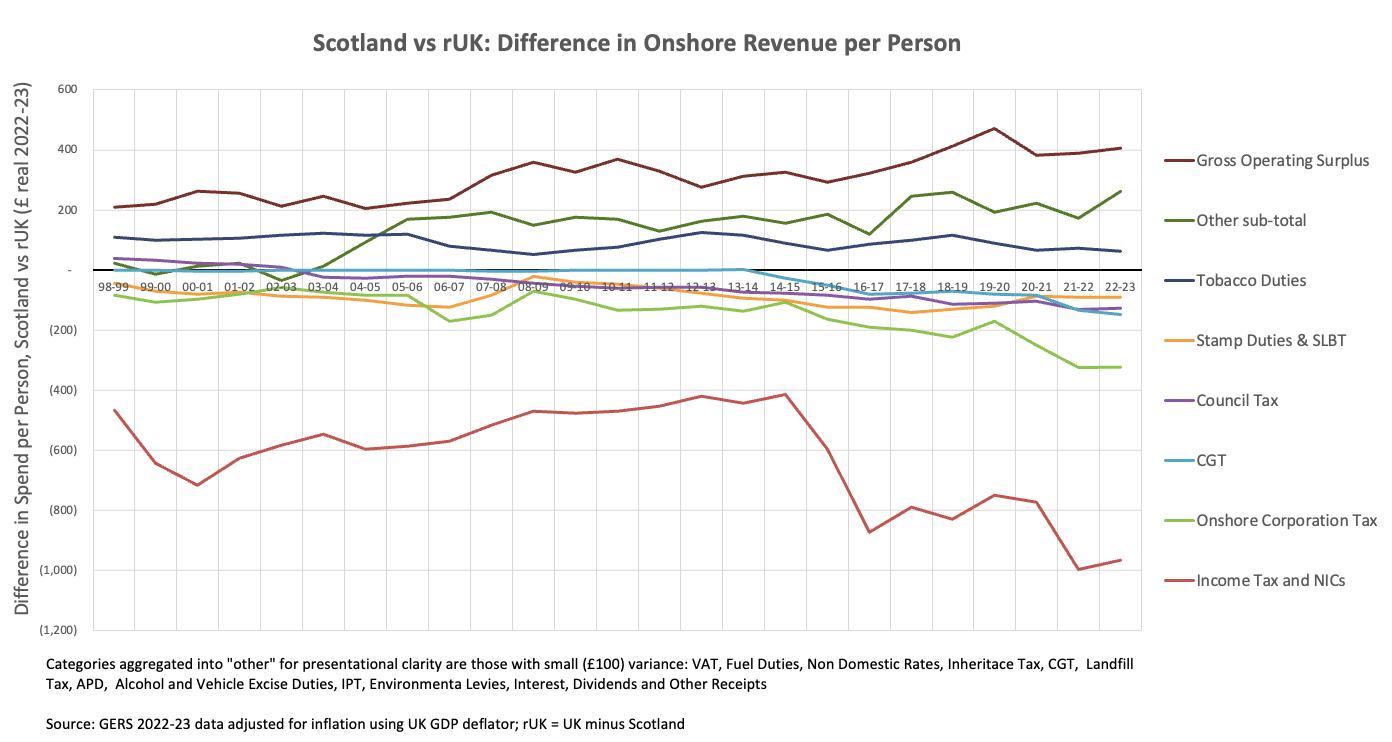
Explanatory Notes:
Gross Operating Surplus includes the operating surplus of publicly owned corporations, most notably Scottish Water (in contrast with England and Wales where water is privatised)
As the GERS FAQ’s make clear: “Corporation tax on trading profits is estimated on a company-by-company basis, depending on the economic activity each company has in Scotland, not simply on the location of company headquarters. VAT, and other taxes such as those related to insurance activity, are related to expenditure, and are therefore estimated based on expenditure that occurs in Scotland, rather than the location of a company’s head office.”
The Scottish Rate of Income Tax (SRIT) was introduced in 2017-18. This led to an improvement in the accuracy of the figures in GERS (which explains the drop between 2014-15 and 2016-17 as the corrections were phased in over these two years). See GERS 2017-18 p.53: “The new Scottish Government powers around tax following Scotland Act 2016 has led to new data sources and more timely information becoming available for income tax and VAT” and GERS Revenue Methodology 2017-18 p.10: “Scotland’s estimated share of UK income tax revenue has been revised down in the latest edition of GERS for 2015-16 and 2016-17, reflecting updated apportionment data from the SPI”.
The drop in recent years suggests that SRIT increases have failed to offset the impact of Scotland’s weaker growth in earnings and employment (versus the UK overall).
The picture when it comes to public spending is much simpler. GERS shows Scotland consistently benefitting from far higher public spending per head than the UK average.
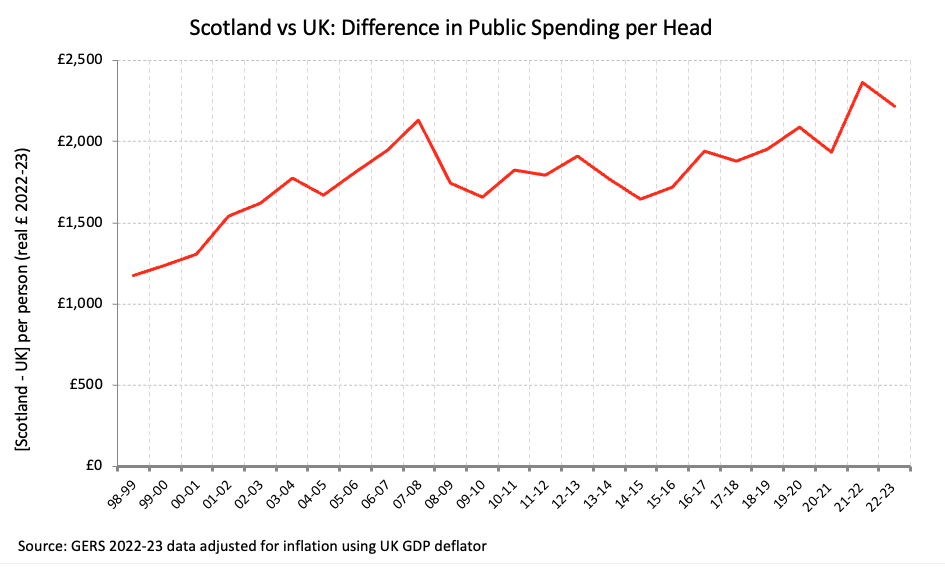
It’s noteworthy that the per capita spending gap between Scotland and the rest of the UK has grown considerably over the last 24 years. This is at least in part explained by Scotland’s relatively lower population growth. The Barnett Formula adjusts changes in public spending on a per capita basis, but in any given year the vast majority of the Block Grant is the prior year’s inherited expenditure. That inherited rump of spending is spread across relatively fewer people in Scotland than in the rest of the UK because Scotland’s population growth is slower, so this causes a widening of the gap in spending per head.
Digging into the detail we can see that Scotland benefits from higher public spending in almost every public expenditure category. The obvious exceptions are Defence, International Services and Public Sector Debt Interest31The minor difference shown is explained by the inclusion of local government pension fund interest expenditure which is a known figure for Scotland. which are allocated on a simple population share basis.
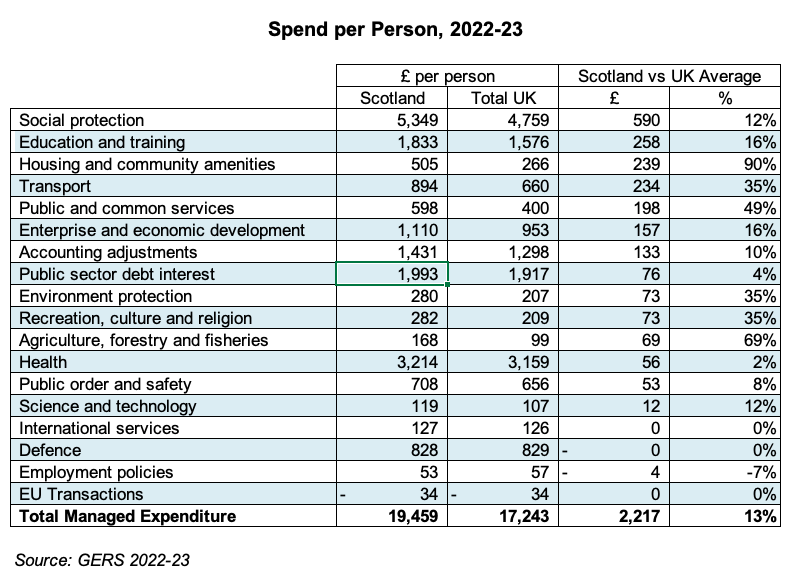
The figures which explain Scotland’s higher spending per head are necessarily those which are not allocated on a simple population share basis. This means that the fact of Scotland’s relatively higher spending per head really should not be controversial. This fact is addressed directly within the GERS report itself:
“… spending per person for Scotland is higher primarily due to spending on devolved services. While there are no official estimates of how spending on devolved services compares in Scotland to other parts of the UK, analysis by bodies such as the Institute of Fiscal Studies suggest that it is between 25% and 30% higher per person in Scotland. This is as a result of the Barnett formula, and slower population growth in Scotland.”
Looking at the spending gaps over time, in the most recent year Scotland has seen a very significant relative up-tick in Social Protection spending.
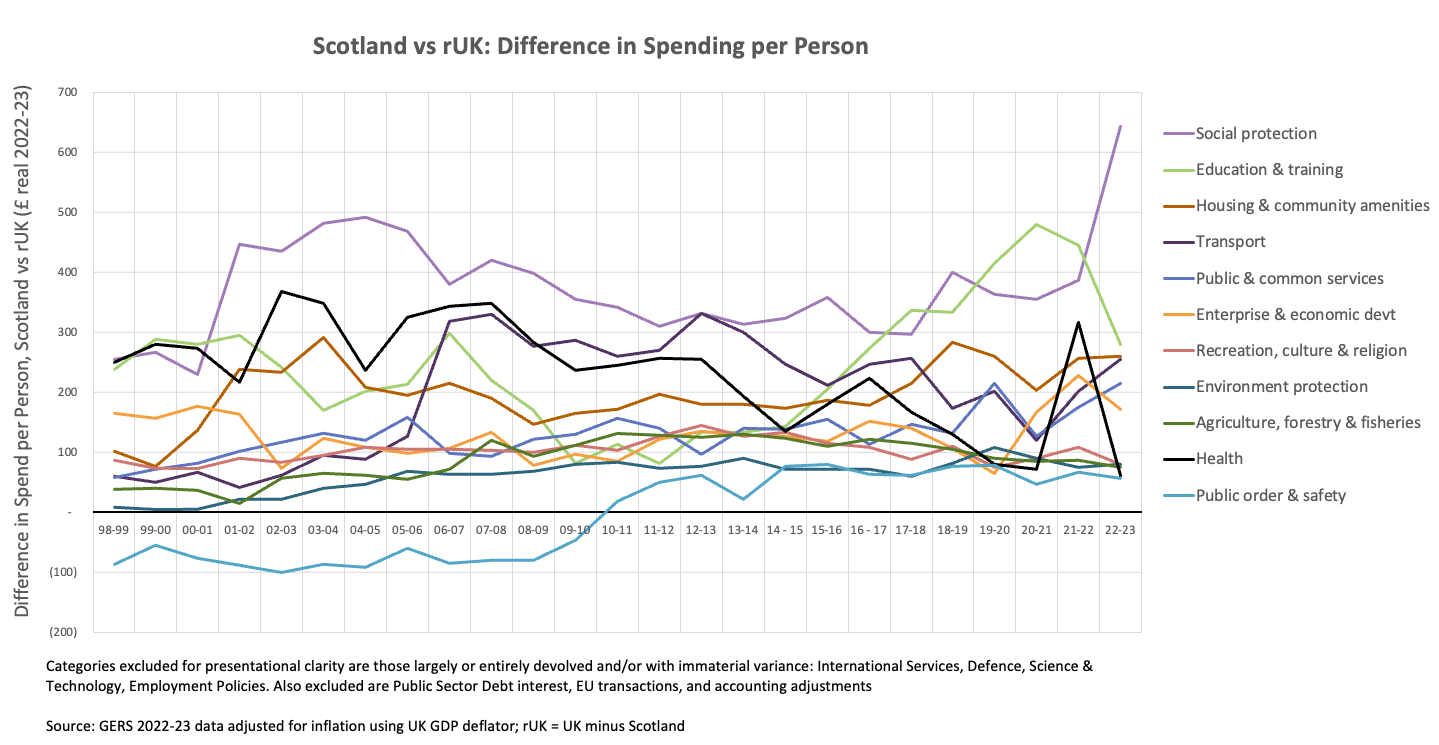
This relative increase is not only due to changes in devolved benefits. In 2022-23 social protection spending across the entire UK grew by 6.2% [GERS Table 3.7]. Reserved social protection spending for Scotland grew by 9.4% and devolved social protection spending increased by 14.4% [GERS Table 3.8]. This neatly illustrates both how reserved spending can reflect higher need (the same policies applied UK-wide have led to a relatively higher increase in reserved social protection spending in Scotland) and how devolved spending allows the Scottish Government to choose different spending priorities.
Appendix 2: Dealing with GERS Deniers
The GERS figures are published by the Scottish Government and compiled by the Scottish Government's own team of statisticians and economists using methodologies and assumptions they have chosen following years of extensive consultation.
The GERS report is an accredited National Statistics publication, meaning it is assessed by the UK Statistics Authority to ensure it meets the standards set out in the Code of Practice for Statistics. To quote the Scottish Government’s own white paper on independence (Scotland’s Future): “GERS is the authoritative publication on Scotland’s public finances."
Any suggestions that the Scottish Government’s own economists and statisticians have – either through incompetence or by design – materially understated the true scale of the revenues generated by Scotland’s economy or overstated the amount of public spending which Scotland benefits do not deserve to be taken seriously.
To address the most common attempts to deny the GERS figures (most of which are now addressed in the GERS FAQs):
-
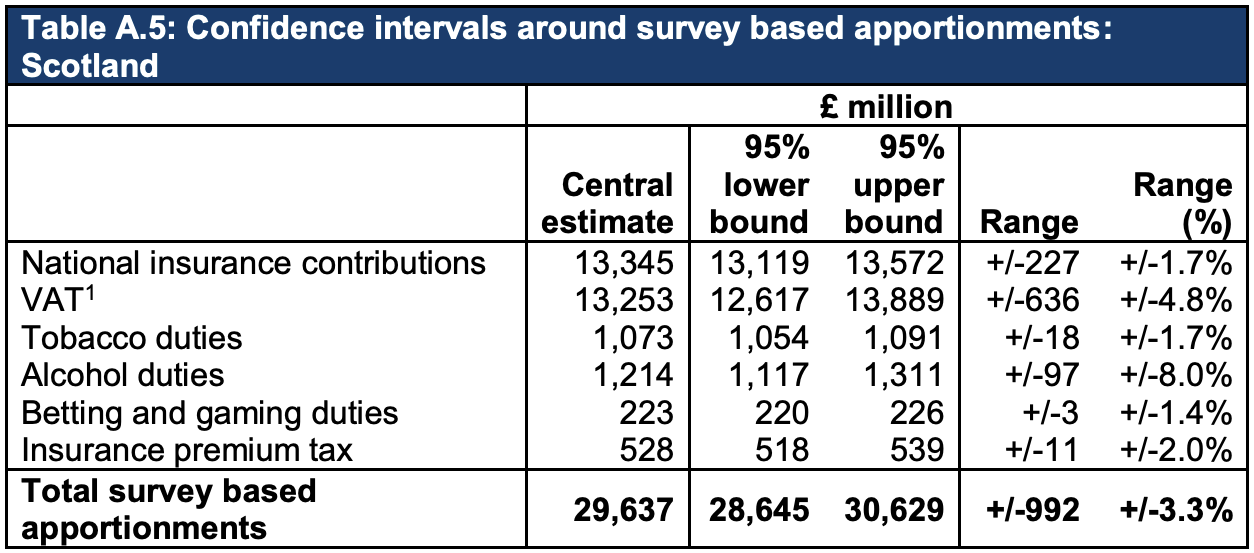
As with all economic statistics, some estimates are required. Most of the estimates relate to revenue allocations which rely on survey data. The GERS report includes standard statistical analysis which provides 95% confidence intervals around these estimates. The estimates could be wrong in either direction, but we can be statistically 95% confident that they are accurate to +/- £1.0 billion (within the context of a fiscal transfer which has averaged £11.5 billion pa over the last decade).
To suggest that the team in St Andrew’s House who compile these figures, after decades of working on them and multiple user consultations, have somehow missed whole revenue streams that should be attributed to Scotland is simply not credible. For the avoidance of doubt:
-
The UK does not have any export taxes (so how exports are measured has no impact on these fiscal accounts)
-
Whisky duty is a consumption tax and appropriately treated as such (Scotland has no more claim on VAT and duty on whisky paid by consumers in England than it has on that paid in France by consumers there)
-
Corporate head-office location is not used to allocate any tax revenue.
-
The geographical share of North Sea revenue used in GERS is based on the median line principle (as employed in 1999 to determine the boundary between Scotland and the rest of the UK for fishery demarcation purposes). Production, costs and revenues are allocated on a field-by-field basis to either the rest of the UK or Scotland (there is no unaccounted for “unknown region” data in this analysis). The net result is that in GERS Scotland has been allocated 89% of the UK’s North Sea revenues over the last decade (in some years >100% due to petroleum revenue tax rebates related to decommissioning activity being mostly in “rest of the UK” waters)
-
Scotland is not allocated any spending relating to infrastructure investments outside Scotland – so for example projects like HS2 and Crossrail have no impact on the GERS deficit.
Given all of the above, we might hope (but in all honesty not expect) that the SNP’s newly formed Rebuttal Unit will address the fact that most independence supporters apparently believe that the GERS figures are “made up by Westminster to hide Scotland’s true wealth”.
Please log in to create your comment