GERS 2025: FULL FISCAL AUTONOMY?
06 September 2025
Kevin Hague uses the latest GERS figures to compare Scotland’s fiscal position with independent EU countries and argues that a fiscally autonomous Scotland would need to dramatically reduce investment in public services.
In February every year, the groundhog “Punxsutawney Phil” emerges from his home on Gobbler’s Knob in Pennsylvania. If he sees his shadow and returns to his burrow, six more weeks of winter are predicted. That is the Groundhog Day which Bill Murray was famously doomed to repeat in the film of the same name.
In August every year the Government Expenditure and Revenue Scotland (GERS) report emerges from the office of the Scottish Government’s chief economic advisor in St Andew’s House, Edinburgh. If it shows Scotland’s fiscal deficit being higher than the UK’s, several weeks of spin, counter-spin, obfuscation and misdirection are predicted. GERS Day is the Groundhog Day of Scottish politics, and we seem doomed to repeat it.
Over the years the GERS report has consistently shown Scotland, as an integral part of the UK, benefitting from higher public spending than its tax revenues could otherwise sustain. Unionists argue this shows why Scotland separating from the UK would inevitably lead to reduced investment in public services and/or dramatic tax rises.
Scottish nationalists on the other hand tend to split into two camps. “GERS deniers” try to distract from the numbers by undermining the competence and integrity of the economists and statisticians in St Andrew’s House responsible for producing these National Statistics. Others simply suggest that any excessive Scottish deficit shown by GERS is merely proof that the current fiscal settlement is detrimental to Scotland’s economic progress.
Most of the arguments about how the GERS figures can and should be interpreted are so well-rehearsed (e.g. here) that there is little value in relitigating them. Suffice to say that those who seek to undermine the validity of the figures do so in the hope of keeping the debate away from a substantive discussion about what the figures actually tell us.
It is depressing to observe that Finance Secretary Shona Robison appears to have joined the ranks of the “GERS deniers”. As well as making deeply misleading claims about defence spending in Scotland when the figures were released1https://www.these-islands.co.uk/publications/i404/defence_spending_in_gers_anatomy_of_a_myth.aspx, in a recent finance committee meeting she demonstrated either a complete failure to understand the figures she was quoting or a willingness to continue to misrepresent them.2She incorrectly claimed “most of the defence spending is on capital” (it’s less than 40%, see GERS page 33) and when trying to defend quoting a figure for defence spending in Scotland that did not include personnel costs she stumblingly suggested that “I think it was including [personnel costs]” when it very clearly wasn’t.
So far so Groundhog Day. But what sets this year apart is that Ms Robison recently called not for independence but for full fiscal autonomy (FFA) for Scotland.3https://www.these-islands.co.uk/publications/i402/full_fiscal_arithmetic.aspx Viewing the GERS figures through the lens of fiscal autonomy allows us to refresh what is otherwise a rather stale debate.
FFA differs fundamentally from independence most notably because Scotland would continue to both benefit from and share in UK-wide public spending including, inter alia, defence, historic debt interest and international services. Sharing these costs is the basis on which the GERS figures are calculated, so they give us a clear insight into how much public spending a fiscally autonomous Scotland would need to fund to maintain current public service levels.
Absolutely central to the FFA debate is the fact that spending for Scotland is not currently constrained by the scale of Scotland’s overall deficit (as described in GERS). Full fiscal autonomy would change that: the Scottish Government would be both responsible for and constrained by Scotland’s deficit. Scotland’s capacity for public spending would be determined only by revenues raised by the Scottish economy and the Scottish Government’s ability to raise debt. The GERS deficit would no longer be a figure of mere academic interest; it would become the key determinant of Scotland’s ability to spend on public services and invest in its economy. With great fiscal power comes great fiscal responsibility
The 2024-25 GERS report shows us that, under the SNP’s suggested policy of full fiscal autonomy, Scotland’s deficit would have been £26.2bn or 11.6% of GDP. In the same year the UK’s deficit was 5.1% of GDP and Scotland’s population share of that deficit was £11.9bn.
The £14.3bn difference between those two figures is how much “worse off” Scotland would have been if fiscally autonomous, it is the immediate implication of Scotland taking responsibility for its own deficit rather than just its population share of the UK’s deficit.4There are other fiscal implications of FFA which this figure does not capture, not least the higher cost of debt which an FFA Scotland would face and/or the impracticality of financing a deficit of this scale. This figure is often referred to as the implied fiscal transfer, the amount by which Scotland directly benefits in any given year from the current fiscal settlement.5This calculation assumes only that Scotland currently takes responsibility for its population share of the UK’s deficit (hence the national debt which results from those deficits over time). This is not a controversial assumption. The GERS figures apportion a population share of the UK’s national debt costs to Scotland and the starting point for negotiations around Scotland’s share of the UK’s debt (were Scotland to secede) is widely accepted as being on a population share basis. £14.3bn equates to over £2,600 for every man, woman and child in Scotland. It is equivalent to 69% of Scotland’s total income tax revenues and is 21% greater than Scotland’s entire education budget.
The cause of this fiscal transfer is very easy to understand. Despite generating the same amount of revenue per head as the UK average, Scotland benefits from over £2,600 per head higher public spending.6The exact figures are £91 higher revenue per head and £2,669 higher spending per head. Scotland “takes out” that much more than it “puts in”.
Nationalists who claim Scotland’s deficit is somehow an indictment of the current fiscal arrangements don’t like engaging with the fact of Scotland’s higher public spending. This is because the GERS figures show that UK-wide pooling and sharing of tax revenues (and debt) allows Scotland not just to spend far more on public services than the UK average but, as we will come on to argue, to spend more than the revenue Scotland’s economy could otherwise sustain.
To understand where this higher public spending goes, we need to dig a little deeper into the GERS figures.
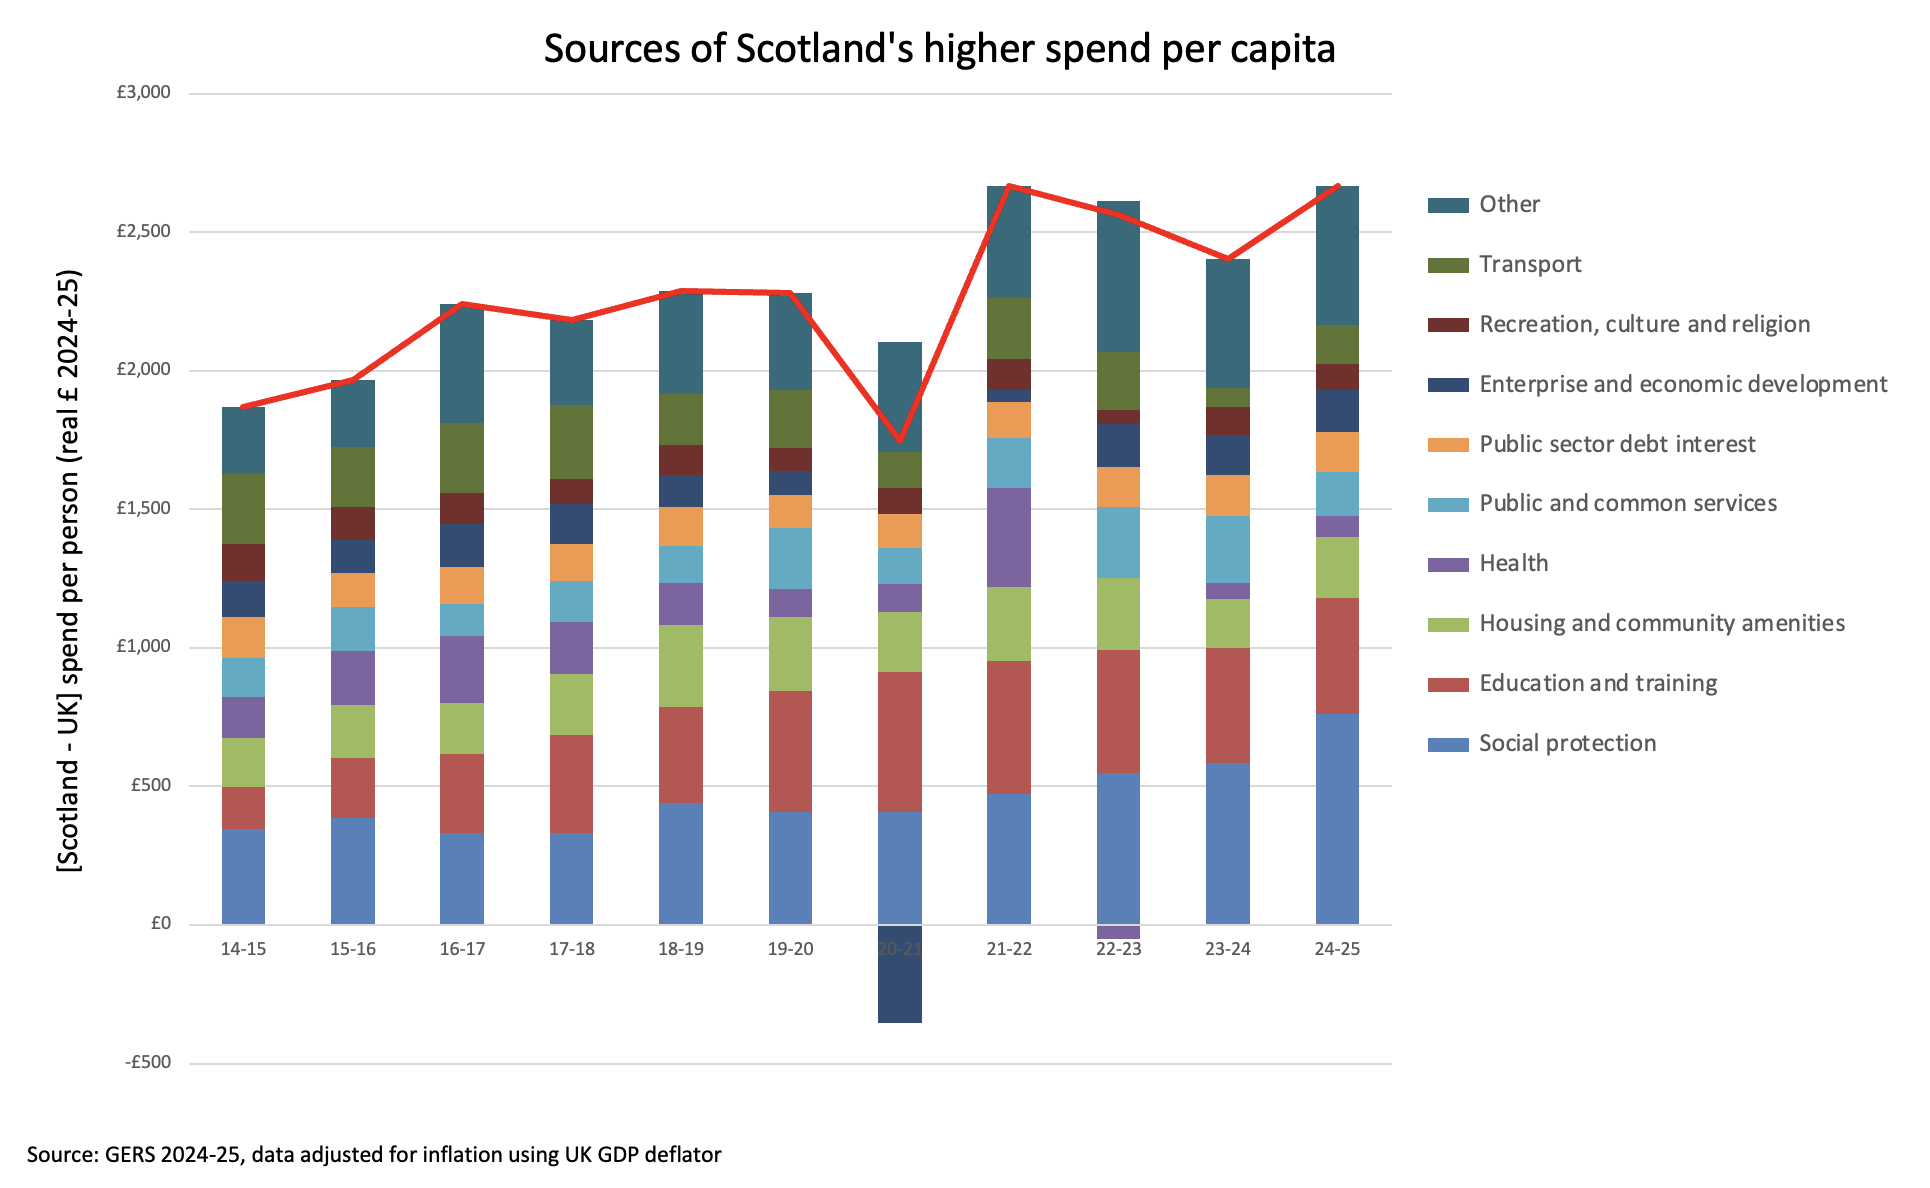
The graph above shows that the gap between Scotland’s public spending per head and the UK average is large and growing. Nearly half of Scotland’s higher spending per head is explained by the costs of social protection (pensions and benefits) and education, with these two categories being responsible for most of the growth in the public spending gap over the last decade.7The “other” figure is largely Accounting Adjustments. As the GERS report itself explains “In general, these adjustments do not affect the net fiscal balance or current budget balance, as they are added to both revenue and expenditure.” Put simply: if you don’t include this figure as an expenditure item you can’t include the equivalent figure already assumed in revenue.
This is mostly (but not exclusively) a devolved spending issue, as the GERS report itself explains:8https://www.gov.scot/publications/government-expenditure-revenue-scotland-2024-25/pages/3/
“For reserved spending such as public sector debt interest, international services, and defence, Scotland is allocated a population share of UK spending, and so spending per person on these areas is the same. As such, spending per person for Scotland is higher primarily due to spending on devolved services.”
A poorly understood element of this debate is that the Barnett Formula (which determines the size of Scotland’s block grant) has been responsible for increasing the gap between Scottish and UK average public spending per head. This phenomenon occurs when, as in recent years, growth in UK public spending is relatively low and Scotland’s population grows more slowly that the UK average.9https://www.these-islands.co.uk/publications/i271/what_is_the_barnett_squeeze.aspx
Whether this higher spending for Scotland is fair or not is a debate for another day. While some of this gap may be justified by demographic differences and the higher costs of delivering services to Scotland’s remote rural and island communities, at the risk of stating the obvious: these factors would not disappear if Scotland were to become fiscally autonomous.
A reasonable question to ask at this stage is whether Scotland’s public spending is unusually high by international standards and, if not, how do other countries manage?
The graph below compares Scotland’s revenue, expenditure and deficit with other EU OECD countries.10To be able to make a like-for-like comparison we need to look at calendar year figures (as this is how the OECD report) and adjust the GERS revenue and expenditure figures to be on a comparable (gross) basis. See appendix for further detail. Any country above the green diagonal line is running a fiscal surplus (i.e. revenue > spending). Any country below the red line is running a deficit greater than the EU’s 3% excessive deficit threshold. The further away from the red line, the greater the fiscal deficit.
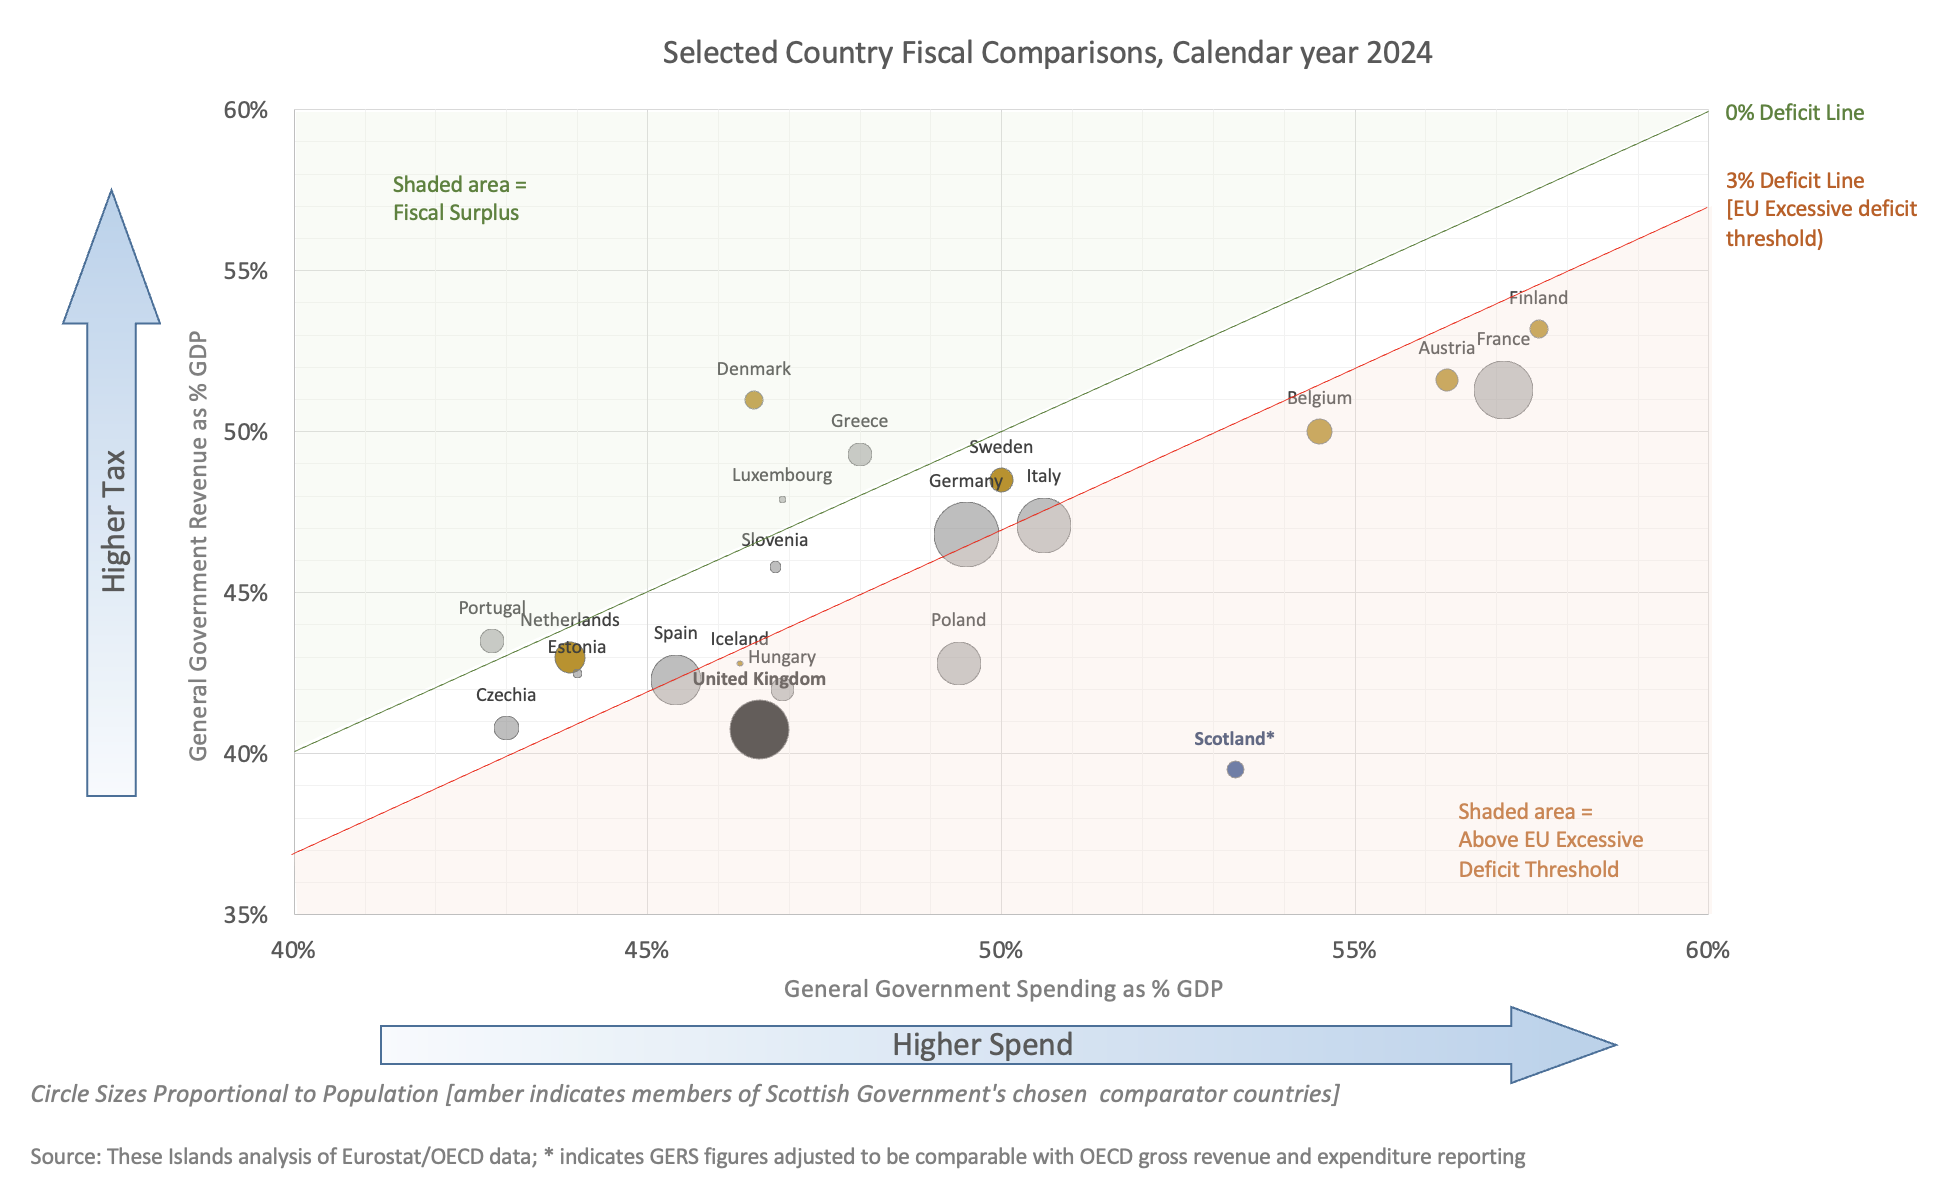
It's clear that, like the UK overall, Scotland is a relatively low tax economy. But unlike the UK overall, Scotland is a relatively high spend economy. This means that Scotland’s deficit is far worse than any comparable EU country. This is because most EU countries have far lower public expenditure than Scotland and those few with similar or higher levels of public spending have far higher levels of taxation.
The conclusion is obvious: to be like any other normal European country, a fiscally autonomous Scotland would have to significantly increase taxes and/or severely cut public spending. A fiscally autonomous Scotland seeking to raise its own debt to fund its own deficit would realistically have no other choice. This is the simple truth that much of the SNP’s rhetoric around GERS seems designed to obscure.
At These Islands we believe the UK Government should treat the SNP’s request for full fiscal autonomy seriously and ask them (in the context of their own GERS figures) what fiscal rules they would apply and how they would propose funding the Scottish deficit.
This would bring into sharp focus the simple fiscal reality that, absent a spectacular rise in Scottish revenues, full fiscal autonomy would lead to dramatic public spending cuts in Scotland. If the SNP were to campaign for Holyrood 2026 with an honest prospectus, they may find that the Scottish electorate do not share their belief that gaining more powers for Holyrood is worth it at any cost.
Appendix: OECD Data Comparisons
General government revenue and expenditure figures are presented in GERS in a way which aligns with ONS Public Sector Finances reporting, but this differs from the way the OECD presents figures.
This point is easily illustrated by comparing these two sources’ figures for the UK. While the deficit figures are the same, the OECD reporting shows both revenue and expenditure as a share of GDP being higher (by an equal amount).
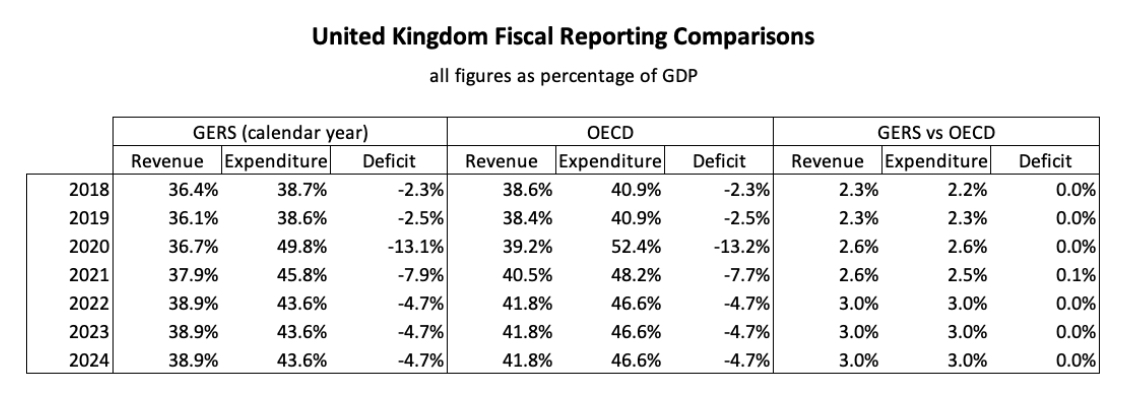
We consulted the ONS to help us understand what causes this reporting difference and the simple answer is that some items which are treated as expenditure by the OECD are netted off against revenue in the GERS/ONS presentation.
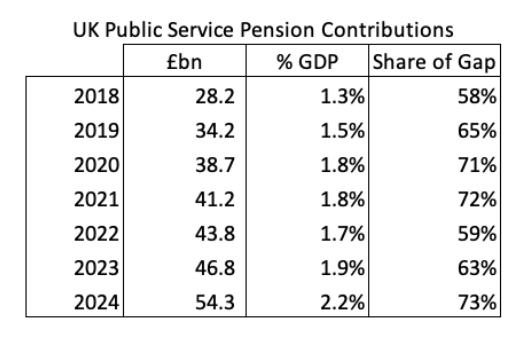
This is perhaps most easily understood by considering the largest example: employees’ public service pension contributions. These are treated as a negative expenditure in GERS but as positive revenue in OECD reporting (and account for most of the gap between the GERS and OECD figures)
When comparing levels of revenue and expenditure between Scotland and EU OECD countries we have therefore assumed that it is reasonable to restate Scotland’s revenue and expenditure figures by amounts which mirror the UK GERS/OECD adjustments (as a % of GDP). The impact of this adjustment is shown below:
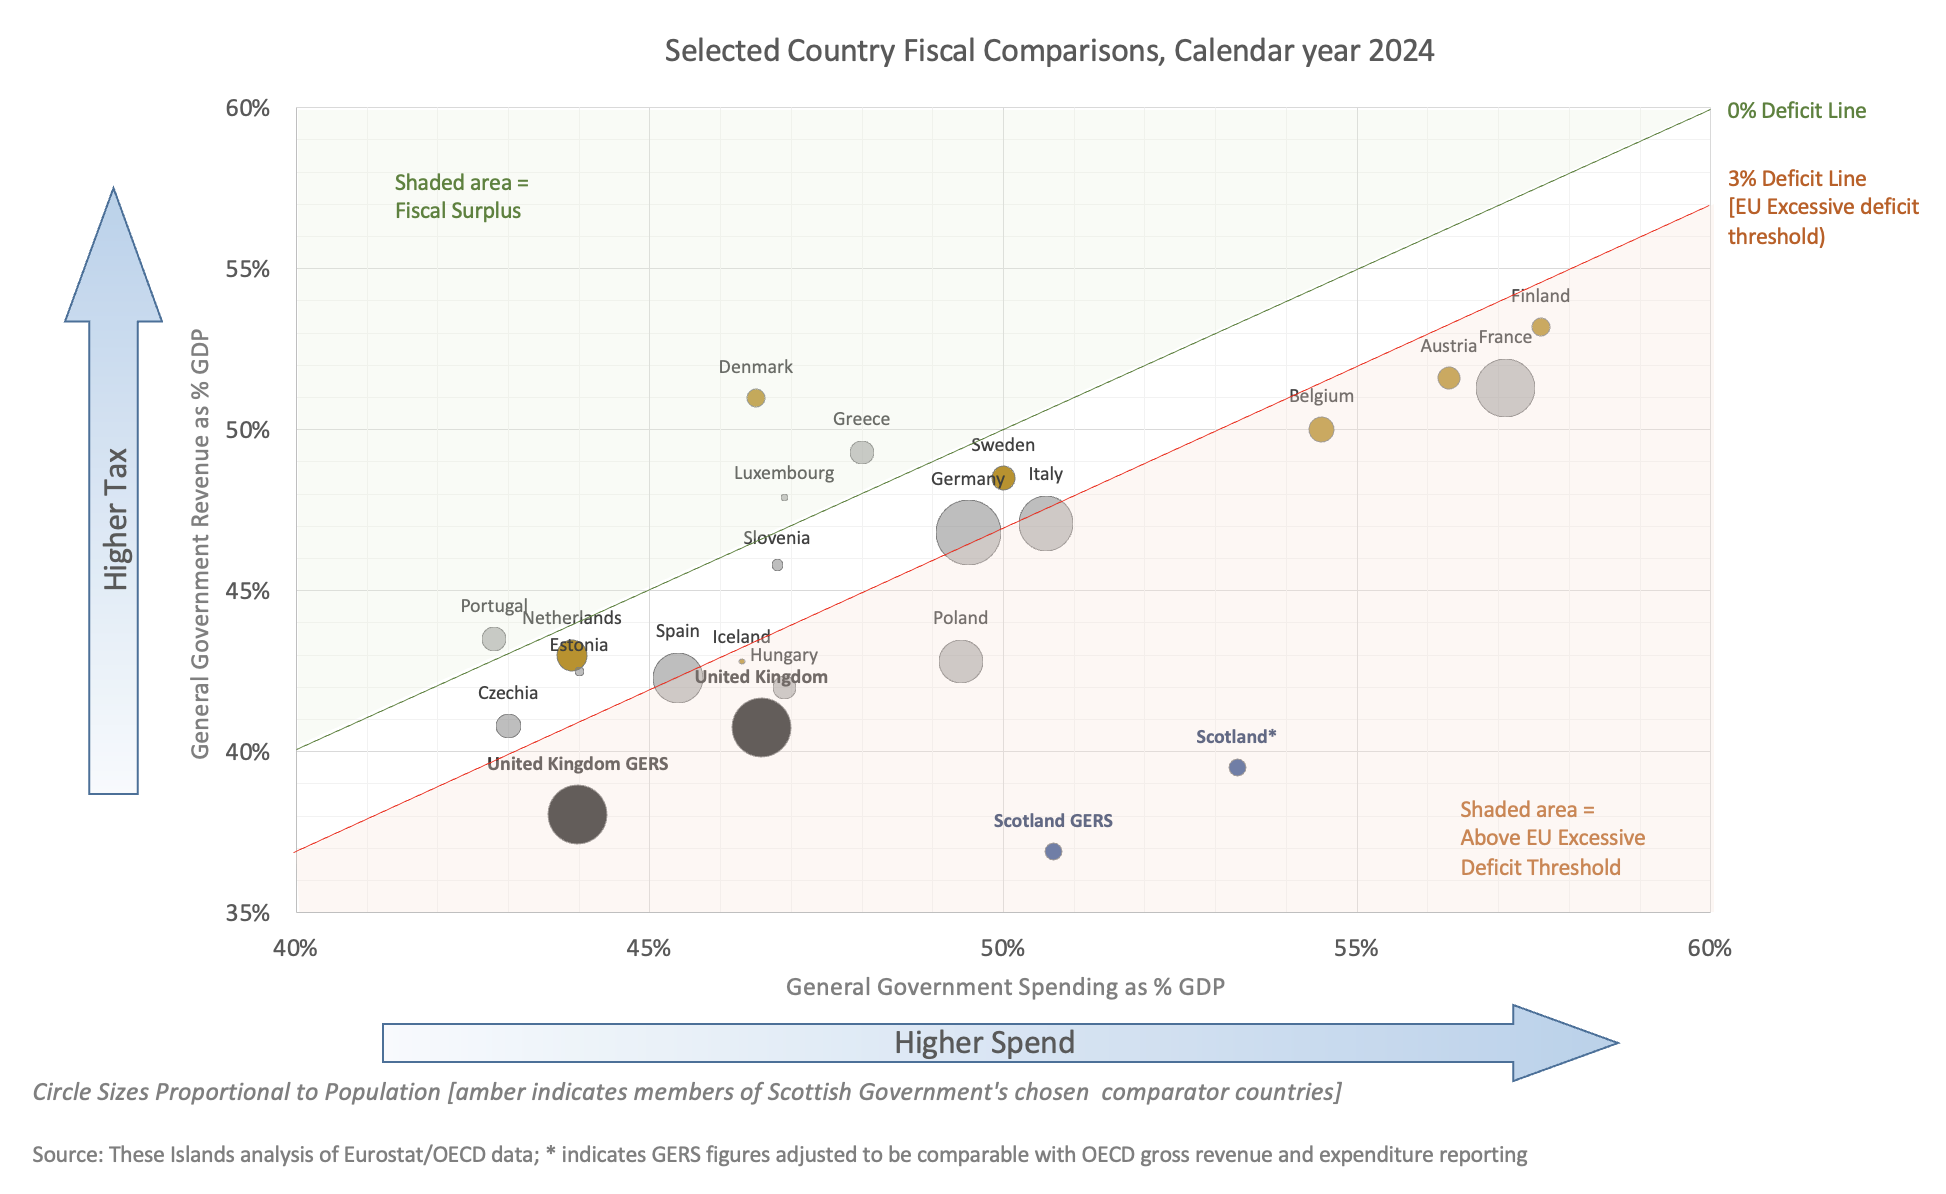
These adjustments move the data points for the UK and Scotland up and to the right, while maintaining the distance from the excessive deficit line (i.e. the reported deficit doesn’t change).
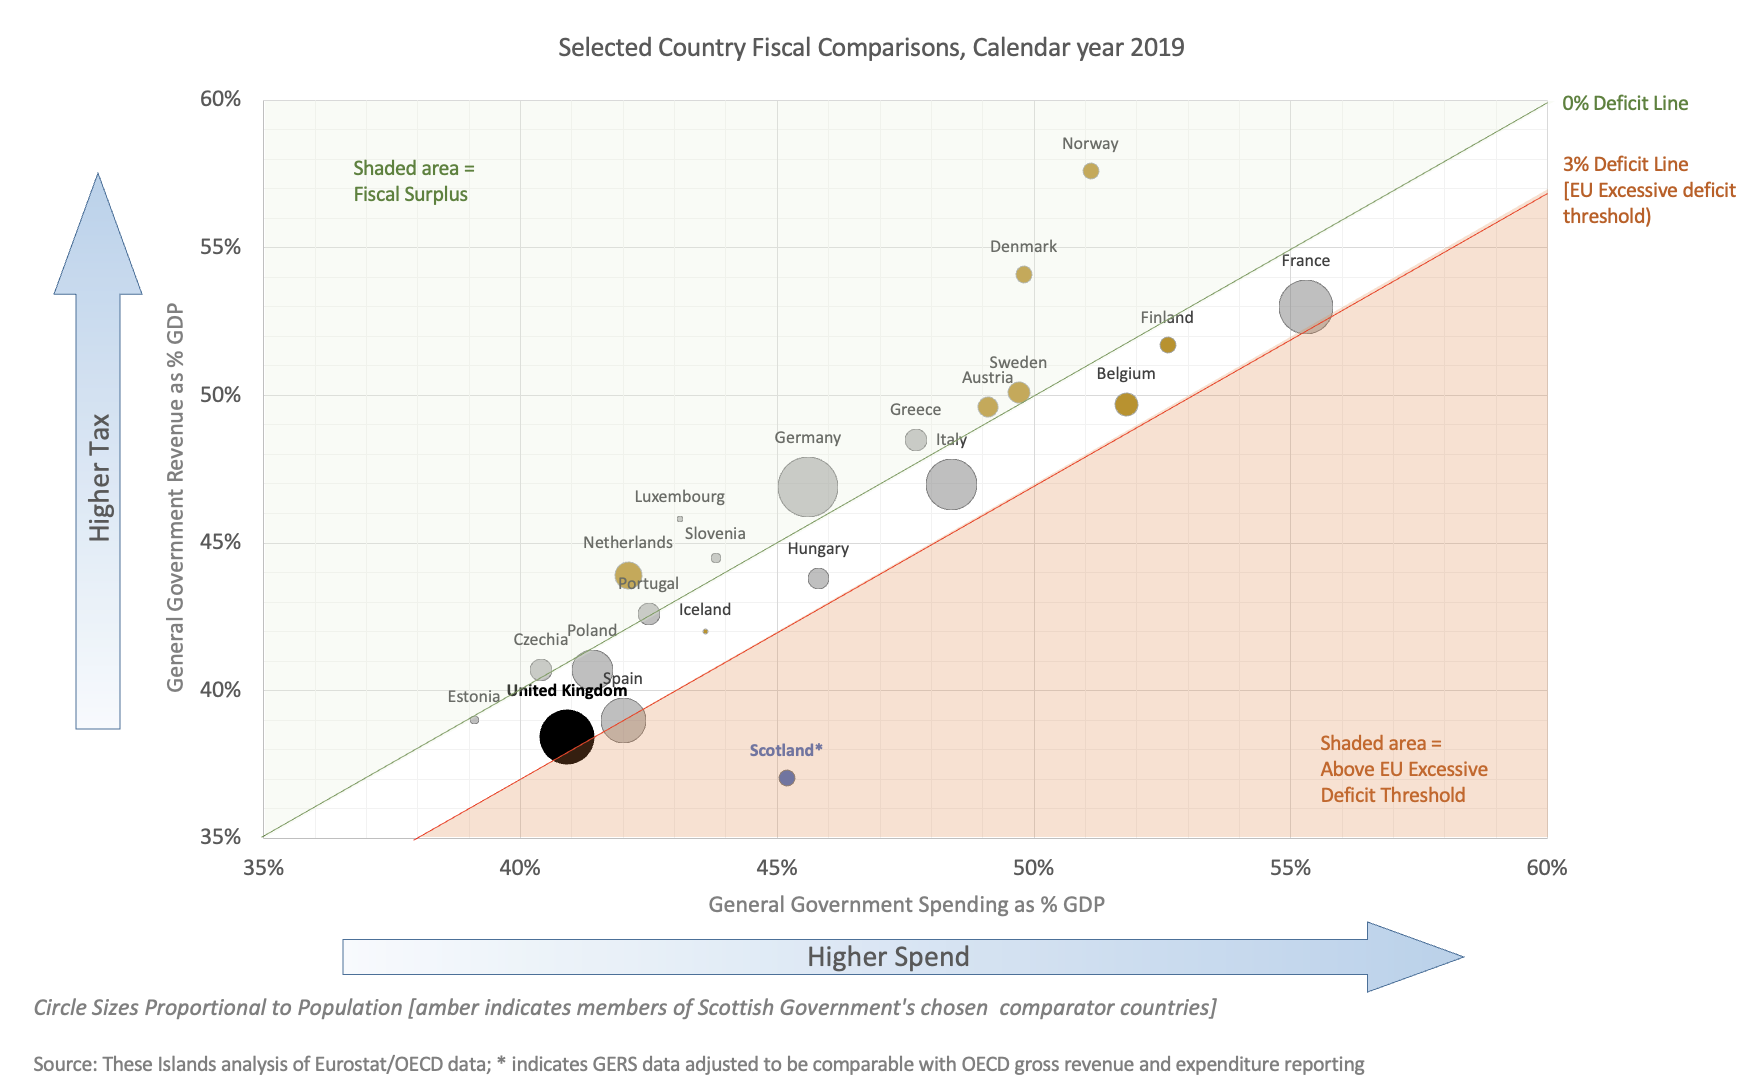
For completeness, the graph below shows the most recent pre-covid year of 2019. The picture changes but the overall message remains the same: countries with similar or higher levels of public spending to Scotland had much higher tax revenues.
Please log in to create your comment